Comparative Study
. 2006 Sep 15;177(6):4149-58.
doi: 10.4049/jimmunol.177.6.4149.

CCR4 participation in Th type 1 (mycobacterial) and Th type 2 (schistosomal) anamnestic pulmonary granulomatous responses

Affiliations
Comparative Study

CCR4 participation in Th type 1 (mycobacterial) and Th type 2 (schistosomal) anamnestic pulmonary granulomatous responses

Christine M Freeman et al. J Immunol. .

Abstract

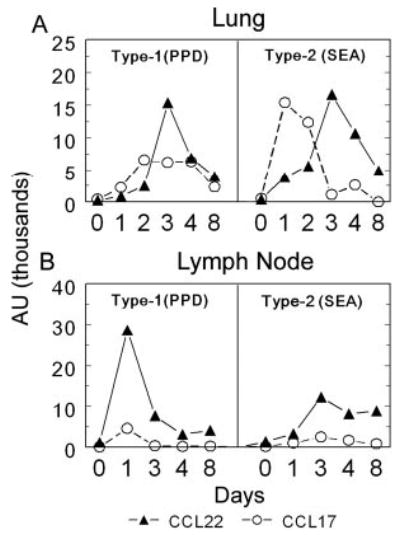
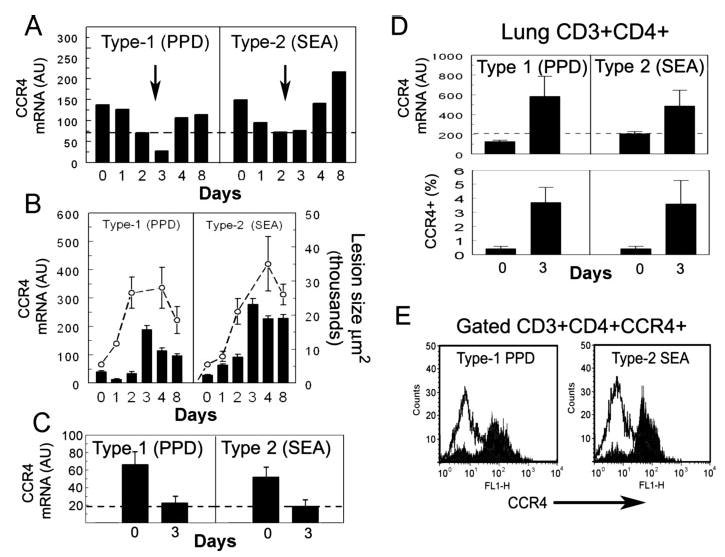
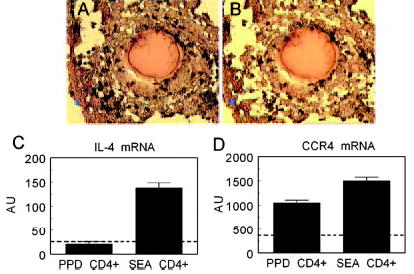
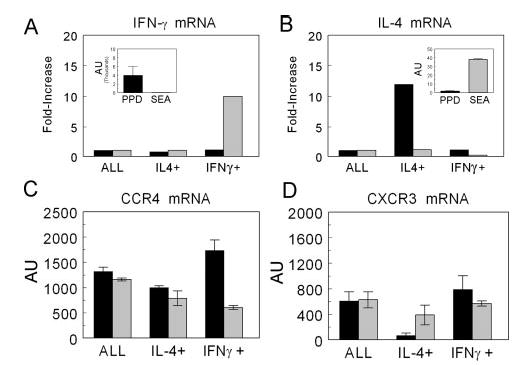
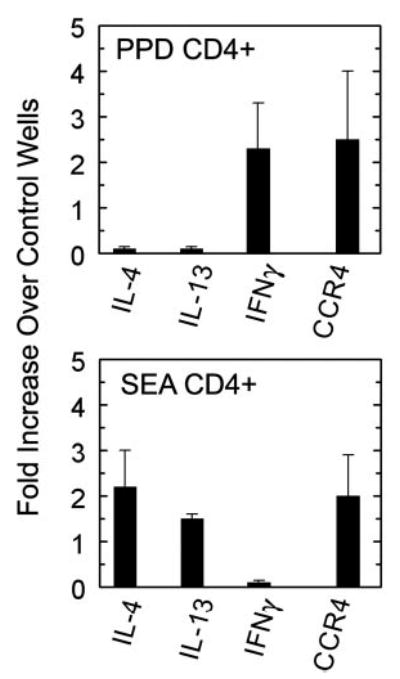
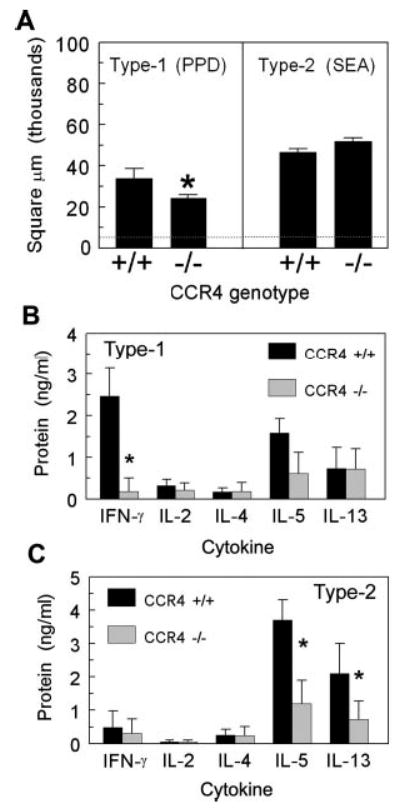
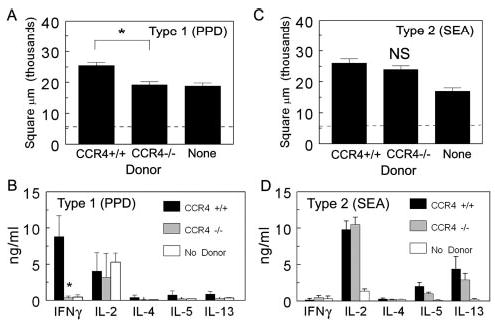
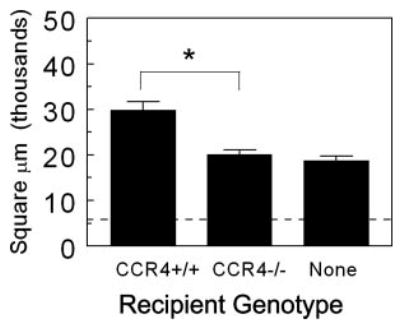
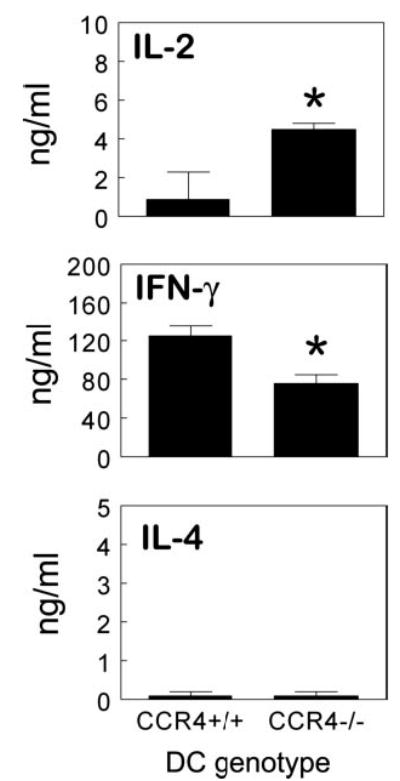
CCR4 is purported to be a Th type 2 (Th2) cell-biased receptor but its functional role is unclear. Recent studies suggest that chemokine receptor expression and function are more complex in vivo and raise doubts regarding restricted CCR4 expression by Th2 cells. To address these issues, we analyzed the role of CCR4 in highly polarized models of Th type 1 (Th1) and Th2 cell-mediated pulmonary granulomas, respectively, elicited by i.v. challenge of primed mice with either mycobacterial purified protein derivative or schistosomal egg Ag-coated beads. CCR4 agonists were expressed during both responses, correlating with a shift of CCR4+ CD4+ T cells from blood to lungs. CCL22 dominated in draining nodes during the Th1 response. Analysis of CD4+ effector T cells revealed CCR4 expression and CCR4-mediated chemotaxis by both IFN-gamma and IL-4 producers. Studies of CCR4 knockout (CCR4(-/-)) mice showed partial impairment of the local type-2 cytokine response and surprisingly strong impairment of the Th1 response with abrogated IFN-gamma production during secondary but not primary challenge. Adoptive transfer indicated CCR4(-/-)CD4+ Th1 cell function was defective but this could not be reconstituted with wild-type (CCR4(+/+)) CD4+ T cells indicating involvement of another CCR4+ population. Coculture of CCR4(+/+)CD4+ T cells and CCR4(-/-) dendritic cells revealed intact IL-2 but impaired IFN-gamma production, pointing to a role for CCR4+ dendritic cells in effector cell expression. Therefore, CCR4 is not Th2-restricted and was required for sustenance and expression of the Th1 effector/memory response to mycobacterial Ags.


Conflict of interest statement

Disclosures The authors have no financial conflict of interest.

Figures

FIGURE 1
FIGURE 1
Time course of CCL17 and CCL22 mRNA expression in lungs and draining lymph nodes during type-1 (PPD) and type-2 (SEA) anamnestic granuloma formation. Lungs and draining lymph nodes were harvested before bead challenge (day 0) and on days 1, 2, 3, 4, and 8 post-Ag-bead challenge. A, Lungs; B, draining lymph nodes. Transcript expression was determined by real-time RT-PCR and expressed as arbitrary units. CCL17, ○; CCL22, ▴. Data are representative of three separate experiments.
FIGURE 2
FIGURE 2
CCR4 expression among peripheral blood CD3+ and CD4+ T cells, whole lungs, and CD4+ lung T cells during type-1 (PPD) and type-2 (SEA) granulomatous responses. Blood and lungs were collected before bead challenge (day 0) and on days 1, 2, 3, 4, and 8 postbead challenge. T cells were isolated from blood and lung as described in Materials and Methods. A, Blood CD3+ T cell CCR4 transcript analysis; dashed line represents transcript levels among blood T cells of naive mice. Values were derived from the pooled blood of 10 mice/point. B, Whole lung analysis; dashed line shows growth of granulomas, bars show mean ± SD, CCR4 transcript levels measured in five to six individual mice per point. C, Blood, days 0 and 3, isolated CD4+ T cell CCR4 transcript analysis; bars show mean ± SD. Dashed lines indicates levels in naive mice CD4+ T cells were isolated from pooled blood and lungs of 5–10 mice before (day 0) and 3 days after challenge. Data are representative of three separate experiments. D, Lung, days 0 and 3, isolated CD4+ T cell CCR4 transcript and flow cytometric analyses. Bars show mean ± SD derived from 4 to 5 mice. E, Representative flow cytometric histograms showing surface expression of CCR4 on CD4+ T cells from granulomatous lungs, on day 3 after bead challenge. Solid area shows staining with CCR4 Ab. Open area is isotype control Ab.
FIGURE 3
FIGURE 3
Lung granuloma CD4+ T cells isolated by LCM express CCR4 transcripts during both type-1 and -2 granuloma formation. Lungs were collected from mice on day 4 after PPD- or SEA-bead challenge. Frozen tissue sections were cut and stained with anti-CD4. LCM was used to excise ~100 CD4+ T cells from five individual granulomas (20 cells/granuloma). A, Sample of SEA-bead granuloma with CD4+ cells stained in brown. B, Same lesion after laser capture microdissection of CD4+ cells. C, IL-4 transcript expression among captured cells. D, CCR4 mRNA transcript expression among captured cells. Dashed lines indicate levels in excised noninflamed control lung tissue. Transcripts were measured by real-time RT-PCR. Bars are mean arbitrary units ± SD. Data are representative of three separate experiments.
FIGURE 4
FIGURE 4
Purification of IFN-γ and IL-4 cytokine-producing CD4+ T cells from lungs during type-1 (PPD) and type-2 (SEA) granuloma formation. Anamnestic lung granulomas were induced in CBA/J mice and on day 3, lungs were collected, homogenized, and cultured overnight with Ag. CD4+ cytokine-secreting populations were isolated as described in Materials and Methods. Relative mRNA transcript levels were measured for IFN-γ (A) and IL-4 (B) with results expressed as the fold increase over the nonenriched CD4+ control (ALL). Insets, The expression in arbitrary units of the CD4+ nonenriched control demonstrates the initial cytokine polarization. Transcript levels of chemokine receptors were measured by real-time RT-PCR in the enriched populations. C, CCR4 transcripts. D, CXCR3 transcripts. Type-1 (PPD) response,█; type-2 (SEA) response,▒. Bars are mean arbitrary units ± SD derived from two separate experiments, five mice per experiment.
FIGURE 5
FIGURE 5
IFN-γ- and IL-4-producing CD4+ T cells induced during type-1 (PPD) and type-2 (SEA) granuloma formation migrate in response to CCL17. CD4+ T cells were isolated from draining lymph nodes collected 3 days after bead challenge. Using a multiwell chemotaxis chamber, 5 and 0 ng/ml CCL17 were added to bottom wells while 3 × 10⁵ CD4+ T cells were added to the top wells. Cells that migrated were collected and analyzed for gene expression by real-time PCR analyses. Results are expressed as a fold increase of transcript expression over the control wells containing randomly migrated cells. Bars are means ± SD from two to three separate experiments.
FIGURE 6
FIGURE 6
Type-1 and -2 granuloma formation and cytokine production in CCR4−/− mice. A, Granuloma cross-sectional area. Lesions were measured on day 4 after PPD or SEA-Ag bead challenge. The dashed line represents the average area of the bead alone. Bars are means ± SD derived from three separate experiments. B, Cytokine production by cultured type-1 (PPD) granulomas. C, Cytokine production by cultured type-2 (SEA) granulomas. On day 4, type-1 and -2 granulomas were isolated from lungs and cultured with Ag for 24 h. Supernatant cytokine levels were determined by ELISA. Bars are means ± SD from three separate experiments. *, p < 0.05 compared with CCR4+/+ mice.
FIGURE 7
FIGURE 7
CCR4−/− CD4+ T cells fail to transfer type-1 granuloma formation to naive CCR4+/+ recipients. CD4+ T cells were isolated from PPD- or SEA-sensitized CCR4+/+ and CCR4&minus;/− mice, then transferred as described in Materials and Methods. Four days later, lungs and draining lymph nodes were harvested. A and C, Granuloma cross-sectional areas, PPD and SEA models, respectively. Dashed line represents the area of the bead alone. B and D, Cytokine production by cultured draining lymph nodes derived from cell recipients and controls, PPD and SEA models, respectively. Bars are means ± SD derived from two separate experiments. *, p < 0.05 comparing mice that received CCR4−/− CD4+ T cells to those that received CCR4+/+ CD4+ T cells.
FIGURE 8
FIGURE 8
Wild-type CCR4+/+CD4+ T cells fail to transfer secondary type-1 mycobacterial Ag-elicited granuloma formation to CCR4−/− mice. PPD-sensitized CD4+ T cells were isolated from the axillary lymph nodes of donors. One million cells were administered i.v. to naive CCR4+/+ and CCR4−/− recipients. Recipients were challenged with PPD beads the following day. Granuloma cross-sectional area was measured 4 days after bead challenge. Data are representative of three separate transfer experiments. Dashed line indicates area occupied by bead alone. Bars are means ± SD. *, p < 0.05.
FIGURE 9
FIGURE 9
Sensitized wild-type CCR4+/+CD4+ T cells display diminished IFN-γ production when cultured with CCR4−/− DCs. CD4+ T cells and CD11c+ DCs were isolated from the axillary lymph nodes of PPD-sensitized donors. CCR4+/+CD4+ T cells were cultured with either CCR4+/+ or CCR4−/− DCs at a ratio of 10:1 for 72 h with PPD Ag. Cytokine levels were determined in culture supernatants by ELISA. Data are representative of two separate experiments, four to five mice per group. Bars are means ± SD. *, p < 0.05 comparing CCR4−/− to CCR4+/+ DC cultures.

References

    1. Santana MA, Rosenstein Y. What it takes to become an effector T cell: the process, the cells involved, and the mechanisms. J Cell Physiol. 2003;195:392–401. - PubMed
    1. Mosmann TR, Coffman RL. TH1 and TH2 cells: different patterns of lymphokine secretion lead to different functional properties. Annu Rev Immunol. 1989;7:145–173. - PubMed
    1. Campbell DJ, Debes GF, Johnston B, Wilson E, Butcher EC. Targeting T cell responses by selective chemokine receptor expression. Semin Immunol. 2003;15:277–286. - PubMed
    1. O’Garra A, McEvoy LM, Zlotnik A. T-cell subsets: chemokine receptors guide the way. Curr Biol. 1998;8:R646–R649. - PubMed
    1. Qin S, Rottman JB, Myers P, Kassam N, Weinblatt M, Loetscher M, Koch AE, Moser B, Mackay CR. The chemokine receptors CXCR3 and CCR5 mark subsets of T cells associated with certain inflammatory reactions. J Clin Invest. 1998;101:746–754. - PMC - PubMed

Publication types

MeSH terms