

Estimating sampling frequency in pollen exposure assessment over time
- PMID: 16951756
- PMCID: PMC2435284
- DOI: 10.1039/b605440d
Estimating sampling frequency in pollen exposure assessment over time
Abstract
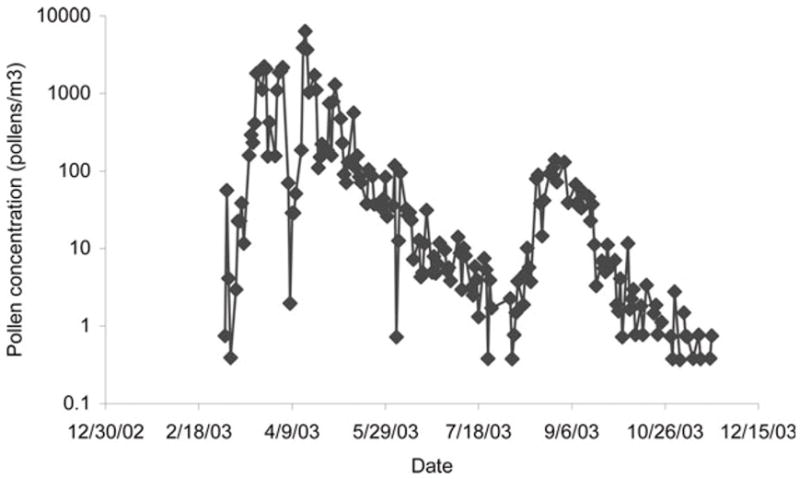
A time series model was fitted to the pollen concentration data collected in the Greater Cincinnati area for the Cincinnati Childhood Allergy and Air Pollution Study (CCAAPS). A traditional time series analysis and temporal variogram approach were applied to the regularly spaced databases (collected in 2003) and irregularly spaced ones (collected in 2002), respectively. The aim was to evaluate the effect of the sampling frequency on the sampling precision in terms of inverse of standard error of the overall level of mean value across time. The presence of high autocorrelation in the data was confirmed and indicated some degree of temporal redundancy in the pollen concentration data. Therefore, it was suggested that sampling frequency could be reduced from once a day to once every several days without a major loss of sampling precision of the overall mean over time. Considering the trade-offs between sampling frequency and the possibility of sampling bias increasing with larger sampling interval, we recommend that the sampling interval should take values from 3 to 5 days for the pollen monitoring program, if the goal is to track the long-term average.
Figures


References
-
- Myszkowska D, Stepalska D, Obtulowics K, Porebski G. Aerobiologia. 2002;18:153–161.
-
- Levetin E. Aerobiologia. 1998;14:21–28.
-
- Pasken R, Pietrowicz JA. Atmos Environ. 2005;39:7689–7701.
-
- Stark PC, Ryan LM, McDonald JL, Burge HA. Aerobiologia. 1997;13:177–184.
-
- Peretz C, Goldberg P, Kahan E, Grady S, Goren A. Ann Occup Hyg. 1997;41:485–500. - PubMed
Publication types
MeSH terms
Substances
Grants and funding
LinkOut - more resources
Full Text Sources
Medical