Review
. 2006 Sep;7(9):874-9.
doi: 10.1038/sj.embor.7400780.

Organellar proteomics: turning inventories into insights

Affiliations
Review

Organellar proteomics: turning inventories into insights

Jens S Andersen et al. EMBO Rep. 2006 Sep.

Abstract

Subcellular organization is yielding to large-scale analysis. Researchers are now applying robust mass-spectrometry-based proteomics methods to obtain an inventory of biochemically isolated organelles that contain hundreds of proteins. High-resolution methods allow accurate protein identification, and novel algorithms can distinguish genuine from co-purifying components. Organellar proteomes have been analysed by bioinformatic methods and integrated with other large-scale data sets. The dynamics of organelles can also be studied by quantitative proteomics, which offers powerful methods that are complementary to fluorescence-based microscopy. Here, we review the emerging trends in this rapidly expanding area and discuss the role of organellar proteomics in the context of functional genomics and systems biology.


Figures

Figure 1
Figure 1
What is an organelle? The figure depicts classical membrane-enclosed organelles, nuclear structures without membranes, and large multiprotein complexes or ‘molecular machines' with distinct morphology and/or function, which can all be considered organelles. They are often highly dynamic: for example, some change their proteome in response to metabolic state and some exist only in certain phases of the cell cycle. PML, promyelocytic leukaemia.
Figure 2
Figure 2
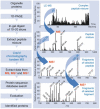
Proteomics workflow. A protein mixture enriched in the organelle of interest is separated by 1D-PAGE. The entire gel band is cut into 10–20 slices, which are trypsin digested. The resulting peptide mixtures are separated by liquid chromatography and peptides are on-line ionized by electrospray mass spectrometry (MS). The panels show the summed ion signals of all the peptides eluting during the chromatographic separation, an example of a mass spectrum of eluting peptides, and a tandem (MS2) spectrum obtained by isolating and fragmenting one of the eluting peptides. The mass and fragmentation information is matched against a sequence database by a search algorithm, resulting in a list of reported protein identifications for the organelle. Peptide sequences can be confirmed with MS3 spectra obtained by isolating and fragmenting the most intense fragment in the MS2 spectra (see Steen & Mann, (2004) for an introduction to peptide sequencing by MS). 1D-PAGE, one-dimensional polyacrylamide gel electrophoresis.
Figure 3
Figure 3
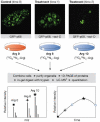
Organellar dynamics using SILAC and fluorescent microscopy. Three cell populations are labelled to completion by isotope-encoded essential amino acids before the experiment. In the example shown here, transcription is inhibited by actinomycin D (act-D) for three different time periods. Cells are mixed and the nucleoli are isolated. Each peptide occurs as a triplet in mass spectrometry (MS) and peak heights reflect the relative amounts of the protein in the nucleolus at each time point. Multiplexing of the experiment results in a kinetic curve of protein recruitment to the nucleolus, in this case for p68. The top panels depict fluorescence microscopy for green fluorescent protein (GFP)-p68. 1D-PAGE, one-dimensional polyacrylamide gel electrophoresis; LC-MS, liquid chromatography MS; SILAC, stable isotope labelling by amino acids in cell culture.
Figure 4
Figure 4
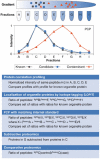
Protein correlation profiling. Fractions adjacent to the peak fraction of an organelle are also measured, and signals from the same peptides are correlated with each other. A quantitative curve is obtained for each protein. Marker proteins for an organelle define a consensus curve and deviation of each protein profile from the consensus curve is a measure of its likelihood of being a genuine member of the organelle. Proteins can be quantified by integrating peptide ion currents (PCP), by stable isotope-based quantification of adjacent fractions (Dunkley et al, 2004) or, most accurately, by using stable isotope labelling by amino acids in cell culture (SILAC) to provide the same internal standard for each fraction. Alternative approaches include subtractive proteomics or comparative proteomics (see main text). PCP, protein correlation profiling.
None
Jens S. Andersen
None
Matthias Mann

References

    1. Aebersold R, Mann M (2003) Mass spectrometry-based proteomics. Nature 422: 198–207 - PubMed
    1. Andersen JS, Wilkinson CJ, Mayor T, Mortensen P, Nigg EA, Mann M (2003) Proteomic characterization of the human centrosome by protein correlation profiling. Nature 426: 570–574 - PubMed
    1. Andersen JS, Lam YW, Leung AK, Ong SE, Lyon CE, Lamond AI, Mann M (2005) Nucleolar proteome dynamics. Nature 433: 77–83 - PubMed
    1. Ashburner M et al. (2000) Gene ontology: tool for the unification of biology. The Gene Ontology Consortium. Nat Genet 25: 25–29 - PMC - PubMed
    1. Broadhead R et al. (2006) Flagellar motility is required for the viability of the bloodstream trypanosome. Nature 440: 224–227 - PubMed