

Structural basis for ligand promiscuity in cytochrome P450 3A4
- PMID: 16954191
- PMCID: PMC1564212
- DOI: 10.1073/pnas.0603236103
Structural basis for ligand promiscuity in cytochrome P450 3A4
Abstract
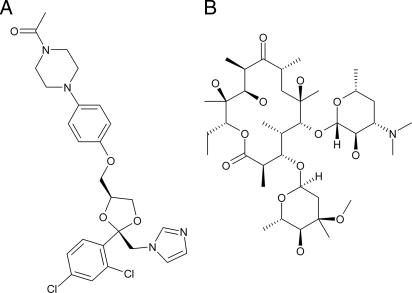
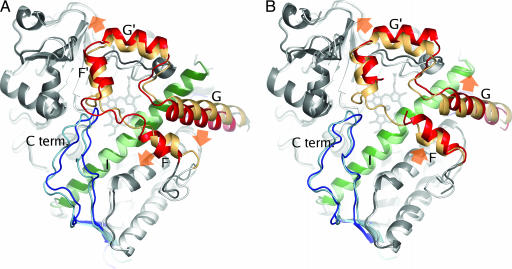
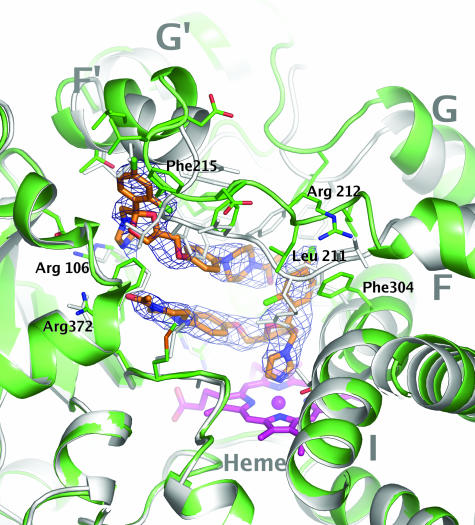
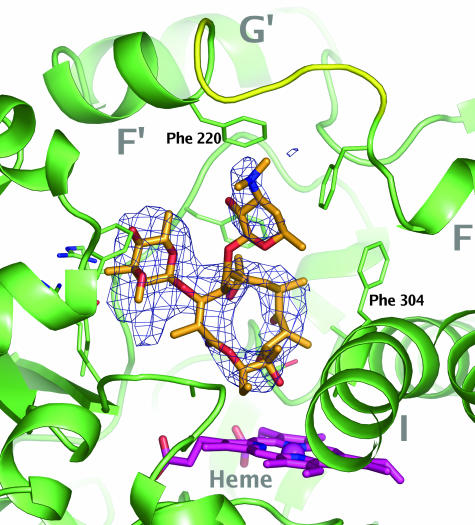
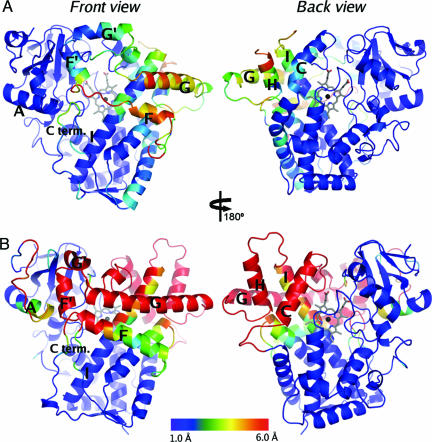
Cytochrome P450 (CYP) 3A4 is the most promiscuous of the human CYP enzymes and contributes to the metabolism of approximately 50% of marketed drugs. It is also the isoform most often involved in unwanted drug-drug interactions. A better understanding of the molecular mechanisms governing CYP3A4-ligand interaction therefore would be of great importance to any drug discovery effort. Here, we present crystal structures of human CYP3A4 in complex with two well characterized drugs: ketoconazole and erythromycin. In contrast to previous reports, the protein undergoes dramatic conformational changes upon ligand binding with an increase in the active site volume by >80%. The structures represent two distinct open conformations of CYP3A4 because ketoconazole and erythromycin induce different types of coordinate shifts. The binding of two molecules of ketoconazole to the CYP3A4 active site and the clear indication of multiple binding modes for erythromycin has implications for the interpretation of the atypical kinetic data often displayed by CYP3A4. The extreme flexibility revealed by the present structures also challenges any attempt to apply computational design tools without the support of relevant experimental data.
Conflict of interest statement
Conflict of interest statement: No conflicts declared.
Figures
Comment in
-
A malleable catalyst dominates the metabolism of drugs.Proc Natl Acad Sci U S A. 2006 Sep 12;103(37):13565-6. doi: 10.1073/pnas.0606333103. Epub 2006 Sep 5. Proc Natl Acad Sci U S A. 2006. PMID: 16954196 Free PMC article. No abstract available.
References
-
- Gibbs MA, Hosea NA. Clin Pharmacokinet. 2003;42:969–984. - PubMed
-
- Williams PA, Cosme J, Sridhar V, Johnson EF, McRee DE. Mol Cell. 2000;5:121–131. - PubMed
-
- Williams PA, Cosme J, Ward A, Angove HC, Matak Vinkovic D, Jhoti H. Nature. 2003;424:464–468. - PubMed
-
- Wester MR, Yano JK, Schoch GA, Yang C, Griffin KJ, Stout CD, Johnson EF. J Biol Chem. 2004;279:35630–35637. - PubMed
-
- Schoch GA, Yano JK, Wester MR, Griffin KJ, Stout CD, Johnson EF. J Biol Chem. 2004;279:9497–9503. - PubMed
MeSH terms
Substances
Associated data
- Actions
- Actions
LinkOut - more resources
Full Text Sources
Other Literature Sources
Molecular Biology Databases
