. 2006 Sep 11;174(6):759-65.
doi: 10.1083/jcb.200606074. Epub 2006 Sep 5.

Luminal particles within cellular microtubules

Affiliations

Luminal particles within cellular microtubules

Boyan K Garvalov et al. J Cell Biol. .

Abstract

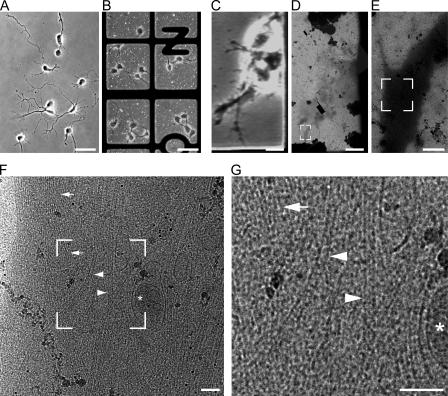
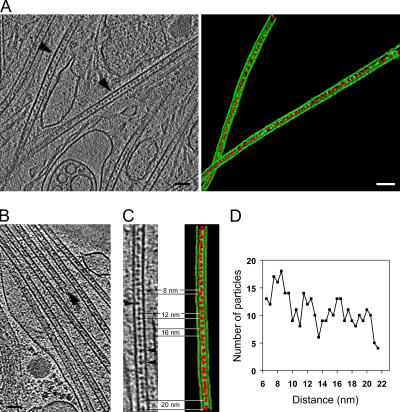
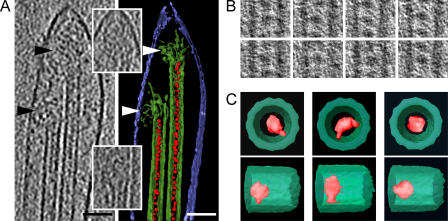
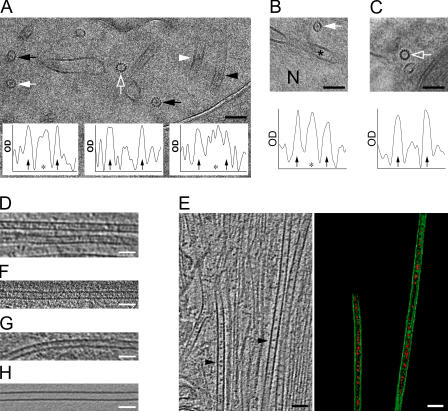
The regulation of microtubule dynamics is attributed to microtubule-associated proteins that bind to the microtubule outer surface, but little is known about cellular components that may associate with the internal side of microtubules. We used cryoelectron tomography to investigate in a quantitative manner the three dimensional structure of microtubules in intact mammalian cells. We show that the lumen of microtubules in this native state is filled with discrete, globular particles with a diameter of 7 nm and spacings between 8 and 20 nm in neuronal cells. Cross-sectional views of microtubules confirm the presence of luminal material in vitreous sections of brain tissue. Most of the luminal particles had connections to the microtubule wall, as revealed in tomograms. A higher accumulation of particles was seen near the retracting plus ends of microtubules. The luminal particles were abundant in neurons, but were also observed in other cells, such as astrocytes and stem cells.


Figures

Figure 1.
Figure 1.
Cultivation and imaging of neurons on EM grids. (A and B) Phase-contrast light microscopy images of 2-d-old rat embryonic hippocampal neurons grown on a glass coverslip (A) and on the carbon support of an EM grid (B). (C) Phase-contrast light microscopy image of a neuronal process. (D) A montage of low-magnification cryo-EM images showing the same region as in C, but after plunge-freezing the grid in liquid ethane. (E–G) Cryo-EM images showing subsequent enlargements in the area along the major process. The boxes in D–F indicate the area magnified in the subsequent image. (G) A projection image recorded at 0° tilt, at the magnification typically used for tilt series (43,000 on the CCD camera). Microtubules (arrowheads), actin bundles (arrows), and membrane organelles (asterisk) are indicated. Bars: (A and B) 50 μm; (C and D) 10 μm; (E) 1 μm; (F and G) 0.1 μm.
Figure 2.
Figure 2.
Cryo-ET of intact neuronal processes reveals luminal particles inside microtubules. (A) A 6-nm-thick slice through a tomogram of a neuronal process. Particulate densities are clearly detectable within the lumen of microtubules (left). The microtubules indicated with arrowheads were surface-rendered in green, with the luminal particles highlighted in red (right). (B) A cross-section through a reconstruction from another neuronal process, showing a bundle of microtubules. The arrow indicates a microtubule end. (C) Magnified view (left) and surface-rendered representation (right) of one microtubule from the tomogram in B. Different distances between neighboring particles (red) can be measured within a short stretch of a single microtubule, typically ranging between 8 and 20 nm. The arrowheads indicate luminal particles with apparent connections to the microtubule wall. (D) Plot of the distribution of the distances between neighboring luminal particles in microtubules, showing peaks at 8, 12, 16, and possibly 20 nm.
Figure 3.
Figure 3.
Enrichment of luminal particles at depolymerizing microtubule ends and modes of binding to the microtubule wall. (A) A slice through a tomogram, corrected for the CTF (left), and a surface-rendered representation (right), showing the end of a shrinking neuronal process with depolymerizing microtubules. The depolymerizing state of the microtubules is indicated by the flared ends of the protofilaments, which are shown in different tomographic sections in the insets (the left and right microtubule flares are displayed in the bottom and top insets, respectively). The color coding is as in Fig. 2, with the plasma membrane depicted in blue. The arrowheads indicate the flared protofilaments. Bar, 50 nm. (B) Examples of luminal particles used for averaging. Most of the particles have apparent connections to the microtubule wall. (C) Surface-rendered averaged volumes in top views (top row) and side views (bottom row). Two types of interactions with the tubulin wall could be detected; single contact (left) and double contact (middle); some particles had no detectable contact (right). All individual panels in B and C are 35 nm wide.
Figure 4.
Figure 4.
Luminal particles in different cell types revealed by CEMOVIS and cryo-ET. (A) Cryo-EM projection image of a vitrified section (CEMOVIS) of neuronal tissue, showing an area within a process containing microtubules with luminal material, seen in both microtubule top views (black arrows) and side views (black arrowhead). Some microtubules have little detectable luminal material (empty arrow). The insets show density profiles across the microtubules indicated with a white arrow (left), an empty white arrow (middle), and white arrowhead (right). The arrows in the plots indicate the position of the microtubule protofilaments; asterisks denote the central density (if detected), generated by the luminal material. (B) CEMOVIS of neuronal tissue, showing a region within the cell body, as indicated by the proximity of the nucleus (N), where microtubules containing luminal material are also observed (white arrow). Asterisk, nuclear envelope. The plot shows the density profile through the microtubule indicated with the arrow. (C) Microtubules from rat HTC cells. The plot shows a density profile through the transversely sectioned microtubule (indicated with an empty white arrow). The density of material inside the microtubule lumen is similar to that of the surrounding cytoplasm. The images in A–C were CTF corrected. (D) Tomographic slice, showing microtubules in an astroglial cell in dissociated hippocampal culture. (E) Tomographic slice, showing a region in a process of a P19 cell grown on an EM grid (left). The two microtubules indicated with arrowheads were surface rendered (right). A 3D view of this tomogram is shown in Video 2. (F and G) Tomographic slices of a microtubule from a PtK2 cell (F) or HeLa cell (G) cultured on EM grids, lacking regular dense particles in the lumen. (H) A tomographic slice of a microtubule nucleated in vitro, devoid of any luminal material. Video 2 is available at http://www.jcb.org/cgi/content/full/jcb.200606074/DC1. Bars, 50 nm.

References

    1. Afzelius, B.A. 1988. Microtubules in the spermatids of stick insects. J. Ultrastruct. Mol. Struct. Res. 98:94–102. - PubMed
    1. Al-Amoudi, A., J.J. Chang, A. Leforestier, A. McDowall, L.M. Salamin, L.P. Norlen, K. Richter, N.S. Blanc, D. Studer, and J. Dubochet. 2004. Cryo-electron microscopy of vitreous sections. EMBO J. 23:3583–3588. - PMC - PubMed
    1. Bassot, J.M., and R. Martoja. 1966. Données histologiques et ultrastructurales sur les microtubles cytoplasmiques du canal éjaculateur des insectes orthoptéres. Z. Zellforsch. Mikrosk. Anat. 74:145–181. - PubMed
    1. Baumeister, W. 2005. From proteomic inventory to architecture. FEBS Lett. 579:933–937. - PubMed
    1. Beck, M., F. Förster, M. Ecke, J.M. Plitzko, F. Melchior, G. Gerisch, W. Baumeister, and O. Medalia. 2004. Nuclear pore complex structure and dynamics revealed by cryoelectron tomography. Science. 306:1387–1390. - PubMed

Publication types

MeSH terms

Substances