Comparative Study
. 2006 Oct 2;203(10):2247-53.
doi: 10.1084/jem.20052477. Epub 2006 Sep 5.

Differential impact of Ink4a and Arf on hematopoietic stem cells and their bone marrow microenvironment in Bmi1-deficient mice

Affiliations
Comparative Study

Differential impact of Ink4a and Arf on hematopoietic stem cells and their bone marrow microenvironment in Bmi1-deficient mice

Hideyuki Oguro et al. J Exp Med. .

Abstract

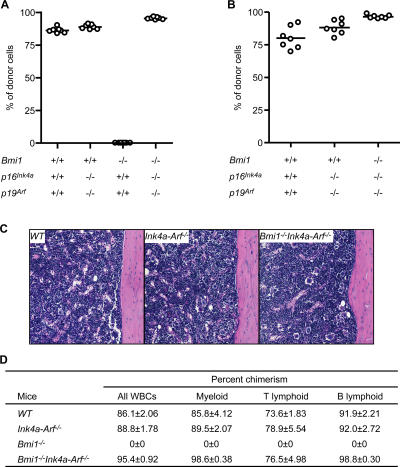
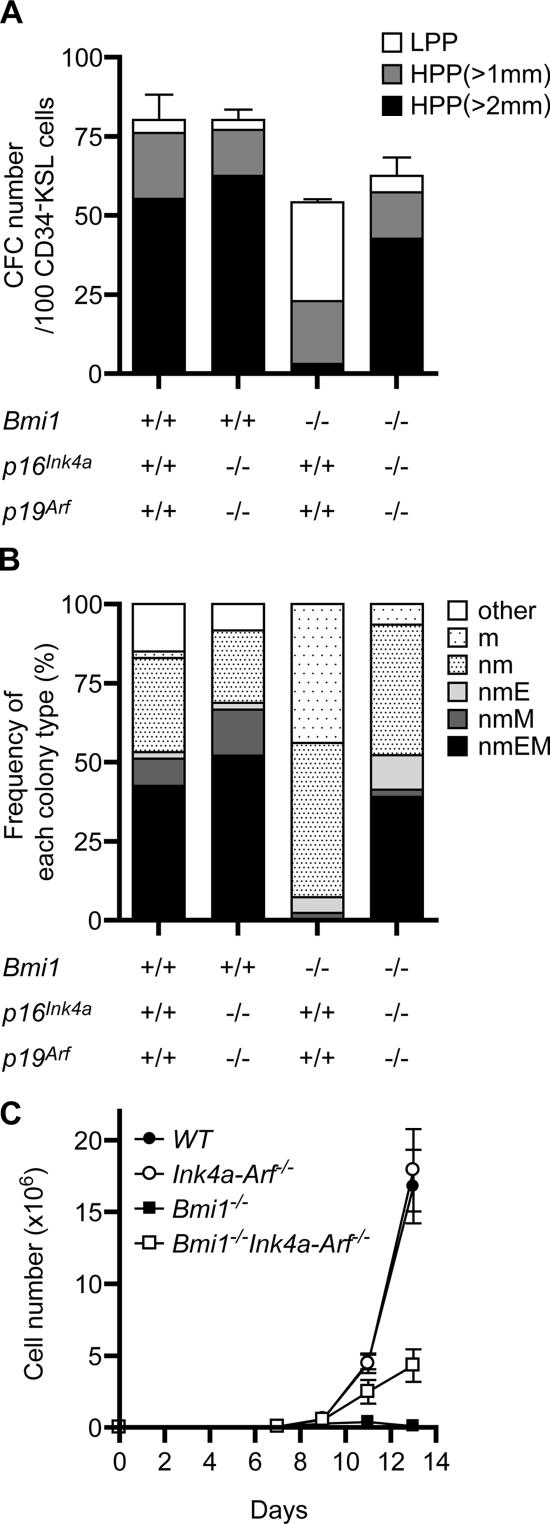
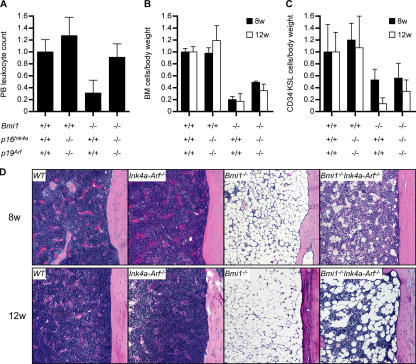
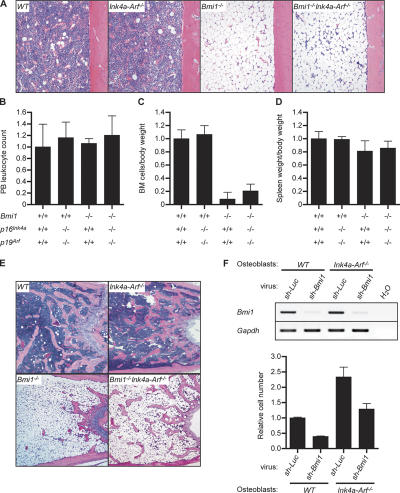
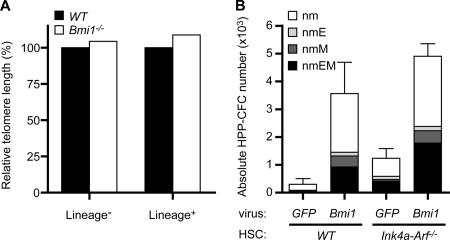
The polycomb group (PcG) protein Bmi1 plays an essential role in the self-renewal of hematopoietic and neural stem cells. Derepression of the Ink4a/Arf gene locus has been largely attributed to Bmi1-deficient phenotypes in the nervous system. However, its role in hematopoietic stem cell (HSC) self-renewal remained undetermined. In this study, we show that derepressed p16(Ink4a) and p19(Arf) in Bmi1-deficient mice were tightly associated with a loss of self-renewing HSCs. The deletion of both Ink4a and Arf genes substantially restored the self-renewal capacity of Bmi1(-/-) HSCs. Thus, Bmi1 regulates HSCs by acting as a critical failsafe against the p16(Ink4a)- and p19(Arf)-dependent premature loss of HSCs. We further identified a novel role for Bmi1 in the organization of a functional bone marrow (BM) microenvironment. The BM microenvironment in Bmi1(-/-) mice appeared severely defective in supporting hematopoiesis. The deletion of both Ink4a and Arf genes did not considerably restore the impaired BM microenvironment, leading to a sustained postnatal HSC depletion in Bmi1(-/-)Ink4a-Arf(-/-) mice. Our findings unveil a differential role of derepressed Ink4a and Arf on HSCs and their BM microenvironment in Bmi1-deficient mice. Collectively, Bmi1 regulates self-renewing HSCs in both cell-autonomous and nonautonomous manners.


Figures

Figure 1.
Figure 1.
Substantial recovery of the defective repopulation capacity of Bmi1−/− HSCs by the deletion of Ink4a and Arf. (A) Competitive lymphohematopoietic repopulating assay. 1 × 10⁶ pooled test BM cells from 4-wk-old mice (B6-Ly5.2) were mixed with 1 × 10⁶ competitor BM cells from 12-wk-old wild-type mice (B6-Ly5.1) and injected into lethally irradiated recipient mice (B6-Ly5.1; n = 7). The percent chimerism of donor cells in the recipient peripheral blood cells 12 wk after transplantation is presented. (B) Secondary transplantation analysis. 2 × 10⁶ pooled BM cells from primary recipients were injected into lethally irradiated secondary recipient mice (B6-Ly5.1; n = 7). The percent chimerism of donor cells 12 wk after transplantation is presented. (A and B) The mean values are indicated as horizontal bars. (C) Hematoxylin and eosin staining of sections of decalcified femur from primary recipients that had transplanted donor cells of the indicated genotype 12 wk before. Donor cell chimerism in the recipient peripheral blood cells was around 90%, as depicted in A and D, and the absolute BM cell numbers were comparable (4.2 × 10⁷ WT cells, 4.75 × 10⁷ Ink4a-Arf −/− cells, and 4.15 × 10⁷ Bmi1 −/− Ink4a-Arf −/− cells for one pair of femur and tibia). (D) The percent chimerism of donor cells in each lineage 12 wk after primary transplantation is presented as the mean ± SD. WBC, white blood cell.
Figure 2.
Figure 2.
The deletion of Ink4a and Arf largely restores the proliferative and differentiation capacity of Bmi1−/− HSCs in vitro. (A) Single HSC growth assay. 96 individual CD34KSL HSCs were sorted clonally into 96-well microtiter plates in the presence of SCF, IL-3, TPO, and EPO. The numbers of high (HPP) and low proliferative potential (LPP) CFCs were retrospectively evaluated by counting colonies on day 14 (HPP- and LPP-CFCs, colony diameters of >1 and <1 mm, respectively). The results are shown as the mean ± SD (error bars) of triplicate cultures. (B) Frequency of each colony type. Colonies derived from HPP-CFCs were recovered and morphologically identified as neutrophils (n), macrophages (m), erythroblasts (E), or megakaryocytes (M). (C) Growth of CD34KSL HSCs in vitro. 50 freshly isolated CD34KSL cells were cultured in the presence of SCF, IL-3, and TPO. The results are shown as the mean ± SD of triplicate cultures.
Figure 3.
Figure 3.
Incomplete recovery of defective hematopoiesis in Bmi1−/−Ink4a-Arf−/− mice. (A) Peripheral blood leukocyte count in 8-wk-old mice (n ≥ 4). (B) BM mononuclear cell count per body weight (n ≥ 3). (C) Quantification of the number of CD34KSL cells per body weight (n ≥ 3). All data were normalized relative to the wild type and are shown as the mean ± SD (error bars). (D) Hematoxylin and eosin staining of sections of decalcified femur from 8- and 12-wk-old mice.
Figure 4.
Figure 4.
Impaired BM microenvironment in Bmi1−/− mice. (A–D) Wild-type, Ink4a-Arf −/−, Bmi1 −/−, and Bmi1 −/− Ink4a-Arf −/− recipient mice were transplanted with 2 × 10⁶ wild-type BM cells. At 4 wk after transplantation, recipient mice were analyzed on their BM cellularity (femur, A), peripheral blood leukocyte count (B), BM cell number per body weight (C), and spleen weight per body weight (D). Donor cell chimerism in recipient peripheral blood mononuclear cells was 80.1 ± 4.2, 78.7 ± 2.4, 98.8 ± 0.38, and 82.5 ± 10.1% with wild-type, Ink4a-Arf −/−, Bmi1 −/−, and Bmi1 −/− Ink4a-Arf −/− recipients, respectively (n ≥ 3). (E) Hematoxylin and eosin staining of sections of decalcified distal femur from 8-wk-old mice. (F) Analyses of Bmi1 knockdown osteoblasts. Primary cultured wild-type and Ink4a-Arf −/− osteoblasts were infected with lentiviruses expressing shRNA against either luciferase (Luc; control) or Bmi1. The infection efficiency was almost 100% in all knockdown experiments. The knockdown efficiencies were evaluated by detecting Bmi1 mRNA expression by RT-PCR analysis (top), and their growth was monitored at day 5 of culture (bottom). The results are shown as the mean ± SD (error bars) of triplicate cultures.
Figure 5.
Figure 5.
Additional targets for Bmi1 exist other than Ink4a and Arf genes in the maintenance of HSCs. (A) The relative telomere length of the BM lineage and lineage+ cells measured by flow fluorescence in situ hybridization. (B) CD34KSL cells were transduced with either GFP control or Bmi1 retroviruses and were cultured in the presence of SCF and TPO. At day 10 of culture, colony assays were performed to evaluate the content of HPP-CFCs in culture. GFP+ colonies derived from HPP-CFCs were examined as to their colony types with morphological analysis. The results are shown as the mean ± SD (error bars) of triplicate cultures. Neutrophils, n; macrophages, m; erythroblasts, E; megakaryocytes, M.

Similar articles

Cited by

References

    1. Lund, A.H., and M. van Lohuizen. 2004. Polycomb complexes and silencing mechanisms. Curr. Opin. Cell Biol. 16:239–246. - PubMed
    1. Valk-Lingbeek, M.E., S.W.M. Bruggeman, and M. van Lohuizen. 2004. Stem cells and cancer: the polycomb connection. Cell. 118:409–418. - PubMed
    1. Iwama, A., H. Oguro, M. Negishi, Y. Kato, and H. Nakauchi. 2005. Epigenetic regulation of hematopoietic stem cell self-renewal by polycomb group genes. Int. J. Hematol. 81:294–300. - PubMed
    1. van der Lugt, N.M., J. Domen, K. Linders, M. van Roon, E. Robanus-Maandag, H. te Riele, M. van der Valk, J. Deschamps, M. Sofroniew, M. van Lohuizen, and A. Berns. 1994. Posterior transformation, neurological abnormalities, and severe hematopoietic defects in mice with a targeted deletion of the bmi-1 proto-oncogene. Genes Dev. 8:757–769. - PubMed
    1. Lessard, J., and G. Sauvageau. 2003. Bmi-1 determines proliferative capacity of normal and leukemic stem cells. Nature. 423:255–260. - PubMed

Publication types

MeSH terms