. 2006 Sep;116(9):2385-92.
doi: 10.1172/JCI28330.

Spontaneous opticospinal encephalomyelitis in a double-transgenic mouse model of autoimmune T cell/B cell cooperation

Affiliations

Spontaneous opticospinal encephalomyelitis in a double-transgenic mouse model of autoimmune T cell/B cell cooperation

Gurumoorthy Krishnamoorthy et al. J Clin Invest. 2006 Sep.

Abstract

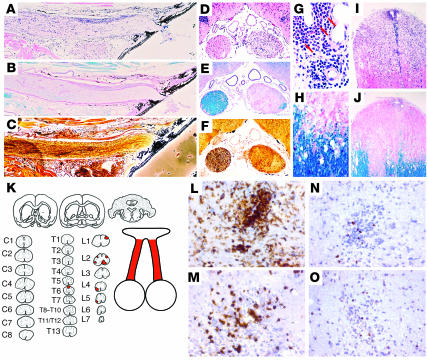
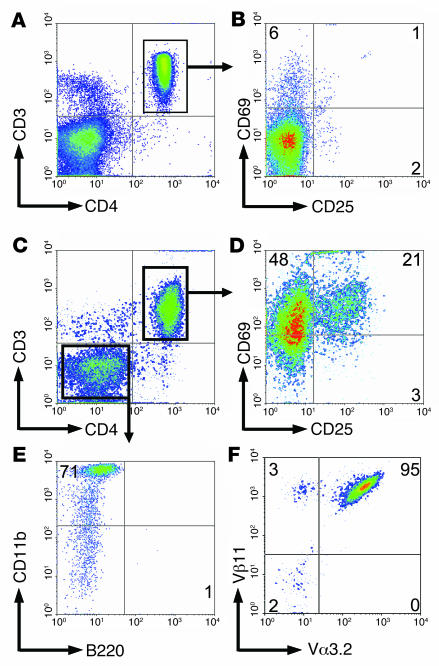
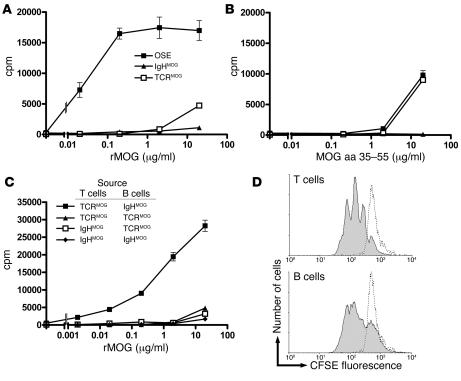
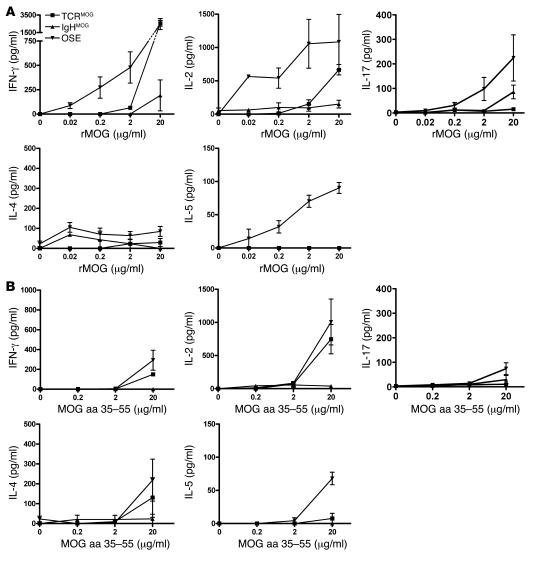
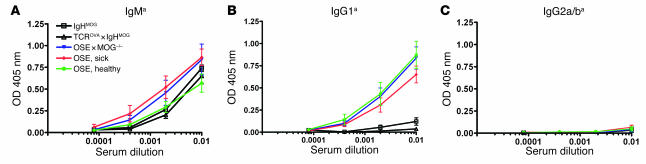
We describe a double-transgenic mouse strain (opticospinal EAE [OSE] mouse) that spontaneously develops an EAE-like neurological syndrome closely resembling a human variant of multiple sclerosis, Devic disease (also called neuromyelitis optica). Like in Devic disease, the inflammatory, demyelinating lesions were located in the optic nerve and spinal cord, sparing brain and cerebellum, and the murine lesions showed histological similarity with their human correlates. OSE mice have recombination-competent immune cells expressing a TCR-alphabeta specific for myelin oligodendrocyte glycoprotein (MOG) aa 35-55 peptide in the context of I-Ab along with an Ig J region replaced by the recombined heavy chain of a monoclonal antibody binding to a conformational epitope on MOG. OSE mouse B cells bound even high dilutions of recombinant MOG, but not MOG peptide, and processed and presented it to autologous T cells. In addition, in OSE mice, but not in single-transgenic parental mice, anti-MOG antibodies were switched from IgM to IgG1.


Figures

Figure 1
Figure 1. Spontaneous EAE-like disease in TCRMOG ×IgHMOG double-transgenic (OSE) mice.
Spontaneous incidence after birth of severe EAE-like disease (clinical score ≥3) was observed in double-transgenic mice housed under SPF conditions (red line; n = 133, 60 females and 73 males). Single-transgenic littermates (IgHMOG, n = 69; TCRMOG, n = 34) and TCROVA×IgHMOG double-transgenic mice (n = 11) remained free of clinical signs during the observation period. Gray lines show disease incidence for male and female OSE mice. The difference in the disease kinetics between sexes was not statistically significant (P = 0.2263).
Figure 2
Figure 2. Histological analysis of the CNS from sick OSE mice.
(AJ and LO) The optic nerves (AF) and spinal cords (GJ and LO) from OSE mice that developed neurological disease in a non-SPF environment showed severe infiltration, demyelination, and axonal damage as visualized by H&E (A, D, G, and I), luxol fast blue (B, E, H, and J), and Bielschowsky silver impregnation (C and F). Arrows in G indicate eosinophilic granulocytes. (K) Demyelinating lesions (red shading) were specifically localized in the optic nerves and spinal cords of OSE mice, thus resembling the lesion distribution observed in human Devic disease. Cervical sections are labeled C1–C8; thoracic sections are labeled T1–T13; lumbar sections of the spinal cord are labeled L1–L7. (LO) Cellular infiltrates were predominantly composed of CD11b+ macrophages/microglia (L) and CD4+ T cells (M), while only few CD8+ T (N) and B cells (O) were found exclusively in the optic nerves and spinal cords of sick mice. Note that healthy OSE littermates remained free of demyelinating CNS lesions (see Supplemental Figure 3). Furthermore, OSE mice housed under SPF conditions showed slightly stronger infiltration/demyelination (see Supplemental Figure 4).
Figure 3
Figure 3. Activated pathogenic CD4+ T cells infiltrate the spinal cord of OSE mice.
(AD) Living splenocytes (A and B) and CNS mononuclear cells (C and D) isolated by Percoll gradient centrifugation from a sick OSE mouse were stained with CD4 and CD3 (A and C), and CD25 and CD69 expression was analyzed among gated CD4+CD3+ double-positive T cells (B and D). (E) Gated CD4CD3 CNS cells were stained with anti-CD11b and anti-B220 in a separate reaction. (F) CD4+CD3+ T cells infiltrating the CNS of sick OSE mice predominantly expressed the pathogenic TCR composed of Vα3.2 and Vβ11 chains. Numbers indicate the percentage of stained cells in the respective quadrant. Flow cytometric data are representative of 7 sick OSE animals analyzed in 4 independent experiments.
Figure 4
Figure 4. Cytokine milieu in the spinal cords of sick OSE mice.
Relative expression level of various cytokine and chemokine genes was assessed by quantitative PCR in the spinal cords of sick OSE mice (n = 5; clinical score ≥3), healthy IgHMOG mice (n = 3), healthy TCRMOG mice (n = 3), and C57BL/6 mice immunized with MOG aa 35–55 (n = 3; clinical score ≥3). Error bars represent SEM from the measurement of individual animals within each experimental group. ND, no gene expression was detectable.
Figure 5
Figure 5. Enhanced autoreactivity of lymphocytes from OSE mice to rMOG.
(A and B) Proliferation of splenocytes from OSE, TCRMOG single-transgenic, and IgHMOG single-transgenic mice in response to increasing concentrations of (A) rMOG and (B) MOG aa 35–55 peptide. (C) Proliferation of CD4+ T cells and B cells isolated from IgHMOG and TCRMOG single-transgenic mice that were combined as indicated after their purification (>90% purity) and stimulated with increasing amounts of rMOG. Note that the combination of MOG-reactive T and B cells caused a substantial increase in proliferation in response to rMOG, comparable to that of OSE splenocytes. (D) Splenocytes from an OSE mouse were labeled with CFSE and stimulated with optimal concentrations of rMOG in vitro. The dilution of cellular CFSE due to proliferation of live-gated CD4+CD3+ T lymphocytes (top) and live-gated CD19+ B lymphocytes (bottom) is shown. Splenocytes that remained without stimulus are represented by dotted lines. In AC, each data point was run in triplicate, and error bars indicate SEM. Experiments in A and B were replicated on multiple occasions (>10), those in C and D were repeated twice.
Figure 6
Figure 6. Cytokine production by transgenic splenocytes in vitro.
(A and B) Splenocytes from OSE, TCRMOG, and IgHMOG mice were stimulated with increasing amounts of (A) rMOG or (B) MOG aa 35–55 peptide, and secreted IFN-γ, IL-2, IL-4, IL-5, and IL-17 cytokines were detected by ELISA. Representative results of a total of 7 OSE, 3 TCRMOG, and 3 IgHMOG animals analyzed during 3 independent experiments are shown. Error bars indicate SEM.
Figure 7
Figure 7. Relative concentrations of MOG-specific serum Ig antibodies in transgenic mice.
MOG-binding antibodies were detected by ELISA in serially diluted sera obtained from healthy (n = 6) and sick (n = 7) OSE, healthy IgHMOG (n = 6), healthy TCROVA×IgHMOG (n = 6), and healthy OSE×MOG–/– (n = 3) mice. Sera (diluted at 10–2, 5 ×10⁻², 2.5 × 10⁻³, and 1.25 × 10⁻⁴) were incubated with plates precoated with rMOG. Bound anti-MOG Ig was detected by allotype-specific antibodies recognizing IgMa (A), IgG1a (B), or IgG2a/ba (C). Mean absorbance at OD 405 nm is shown; error bars indicate SEM.

Comment in

References

    1. O’Riordan J.I., et al. Clinical, CSF and MRI findings in Devic’s neuromyelitis optica. J. Neurol. Neurosurg. Psychiatry. 1996;60:382–387. - PMC - PubMed
    1. Lassmann H., Brück W., Lucchinetti C. Heterogeneity of multiple sclerosis pathogenesis: implications for diagnosis and therapy. Trends Mol. Med. 2001;7:115–121. - PubMed
    1. Kurtzke J.F. Epidemiologic evidence for multiple sclerosis as an infection. Clin. Microbiol. Rev. 1993;6:382–427. - PMC - PubMed
    1. Bach J.-F. The effect of infections on susceptibility to autoimmune and allergic diseases. . N. Engl. J. Med. 2002;347:911–920. - PubMed
    1. Bettelli E., et al. Myelin oligodendrocyte glycoprotein-specific T cell receptor transgenic mice develop spontaneous autoimmune optic neuritis. J. Exp. Med. 2003;197:1073–1081. - PMC - PubMed

Publication types

MeSH terms

Substances