

Biological markers of lung injury before and after the institution of positive pressure ventilation in patients with acute lung injury
- PMID: 16956410
- PMCID: PMC1751077
- DOI: 10.1186/cc5037
Biological markers of lung injury before and after the institution of positive pressure ventilation in patients with acute lung injury
Abstract
Background: Several biological markers of lung injury are predictors of morbidity and mortality in patients with acute lung injury (ALI). The low tidal volume lung-protective ventilation strategy is associated with a significant decrease in plasma biomarker levels compared to the high tidal volume ventilation strategy. The primary objective of this study was to test whether the institution of lung-protective positive pressure ventilation in spontaneously ventilating patients with ALI exacerbates pre-existing lung injury by using measurements of biomarkers of lung injury before and after intubation.
Materials and methods: A prospective observational cohort study was conducted in the intensive care unit of a tertiary care university hospital. Twenty-five intubated, mechanically ventilated patients with ALI were enrolled. Physiologic data and serum samples were collected within 6 hours before intubation and at two different time points within the first 24 hours after intubation to measure the concentration of interleukin (IL)-6, IL-8, intercellular adhesion molecule 1 (ICAM-1), and von Willebrand factor (vWF). The differences in biomarker levels before and after intubation were analysed using repeated measures analysis of variance and a paired t test with correction for multiple comparisons.
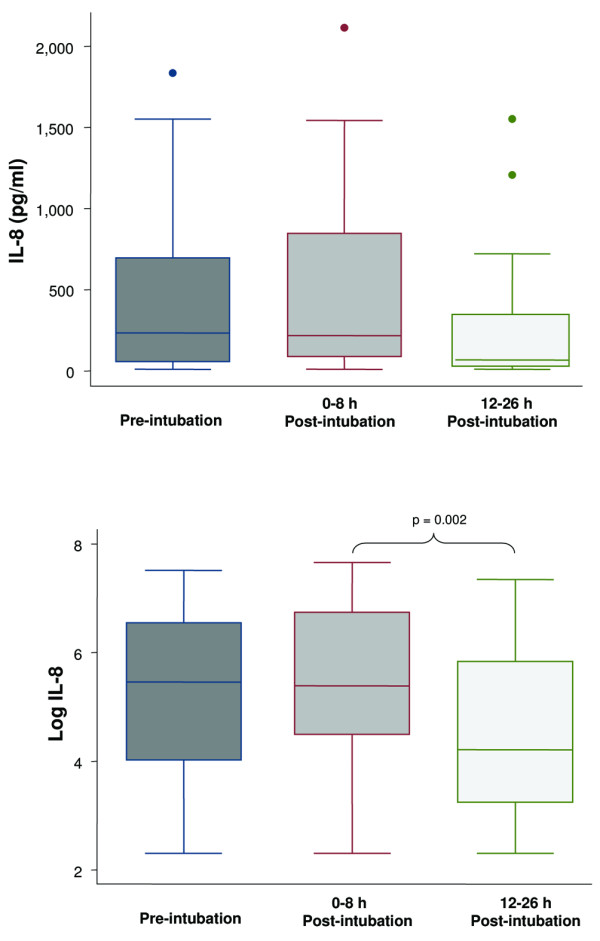
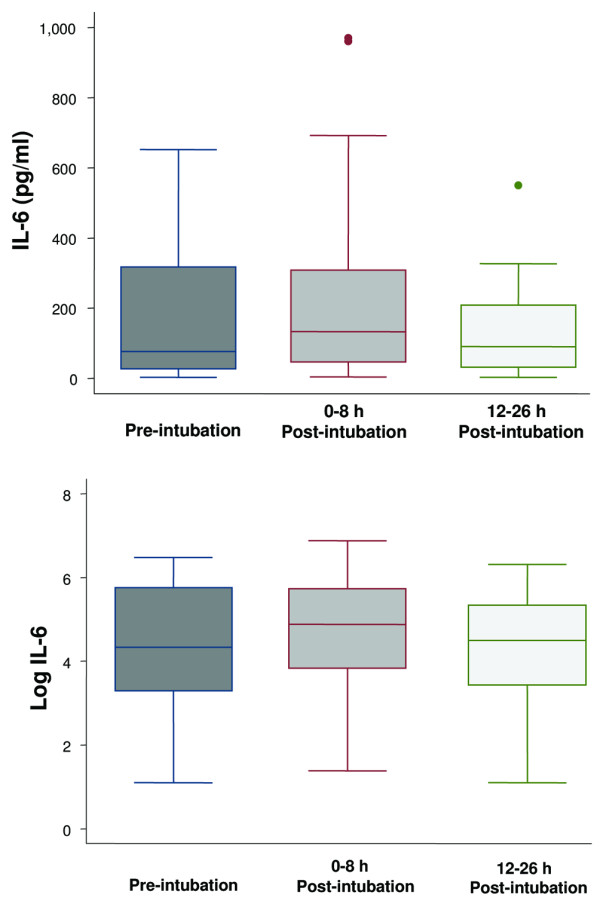
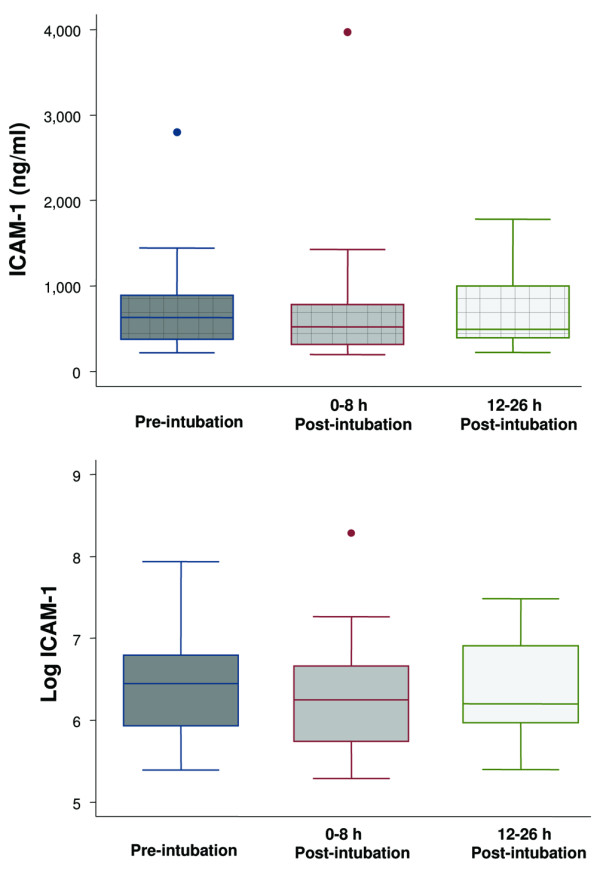
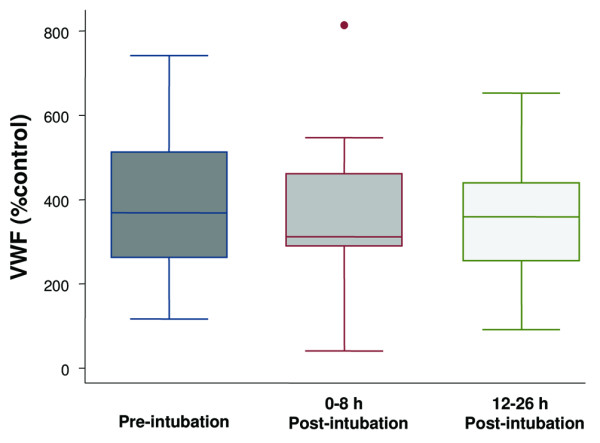
Results: Before endotracheal intubation, all of the biological markers (IL-8, IL-6, ICAM-1, and vWF) were elevated in the spontaneously breathing patients with ALI. After intubation and the institution of positive pressure ventilation (tidal volume 7 to 8 ml/kg per ideal body weight), none of the biological markers was significantly increased at either an early (3 +/- 2 hours) or later (21 +/- 5 hours) time point. However, the levels of IL-8 were significantly decreased at the later time point (21 +/- 5 hours) after intubation. During the 24-hour period after intubation, the PaO2/FiO2 (partial pressure of arterial oxygen/fraction of the inspired oxygen) ratio significantly increased and the plateau airway pressure significantly decreased.
Conclusion: Levels of IL-8, IL-6, vWF, and ICAM-1 are elevated in spontaneously ventilating patients with ALI prior to endotracheal intubation. The institution of a lung-protective ventilation strategy with positive pressure ventilation does not further increase the levels of biological markers of lung injury. The results suggest that the institution of a lung-protective positive pressure ventilation strategy does not worsen the pre-existing lung injury in most patients with ALI.
Figures
References
-
- Brun-Buisson C, Minelli C, Bertolini G, Brazzi L, Pimentel J, Lewandowski K, Bion J, Romand JA, Villar J, Thorsteinsson A, et al. Epidemiology and outcome of acute lung injury in European intensive care units. Results from the ALIVE study. Intensive Care Med. 2004;30:51–61. doi: 10.1007/s00134-003-2022-6. - DOI - PubMed
-
- Amato MB, Barbas CS, Medeiros DM, Magaldi RB, Schettino GP, Lorenzi-Filho G, Kairalla RA, Deheinzelin D, Munoz C, Oliveira R, et al. Effect of a protective-ventilation strategy on mortality in the acute respiratory distress syndrome. N Engl J Med. 1998;338:347–354. doi: 10.1056/NEJM199802053380602. - DOI - PubMed
-
- Hickling KG, Walsh J, Henderson S, Jackson R. Low mortality rate in adult respiratory distress syndrome using low-volume, pressure-limited ventilation with permissive hypercapnia: a prospective study. Crit Care Med. 1994;22:1568–1578. - PubMed
Publication types
MeSH terms
Substances
Grants and funding
LinkOut - more resources
Full Text Sources
Other Literature Sources
Miscellaneous
