. 2006 Nov;80(22):11124-40.
doi: 10.1128/JVI.01076-06. Epub 2006 Sep 6.

Recombination and selection in the evolution of picornaviruses and other Mammalian positive-stranded RNA viruses

Affiliations

Recombination and selection in the evolution of picornaviruses and other Mammalian positive-stranded RNA viruses

Peter Simmonds. J Virol. 2006 Nov.

Abstract

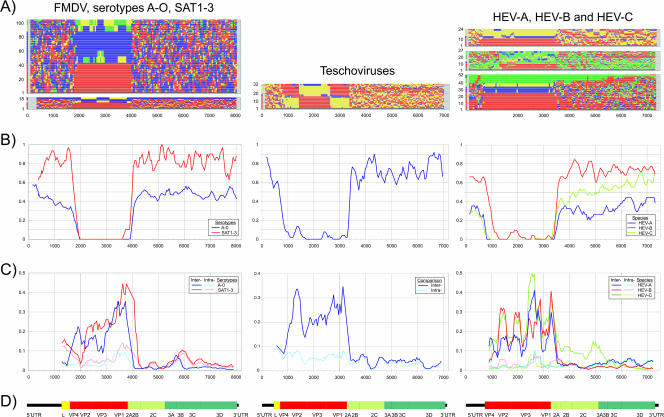
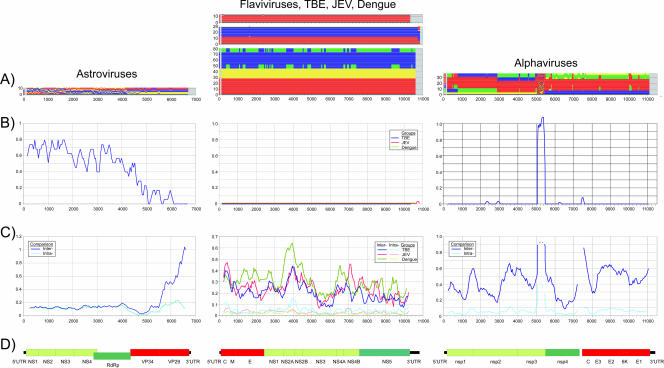
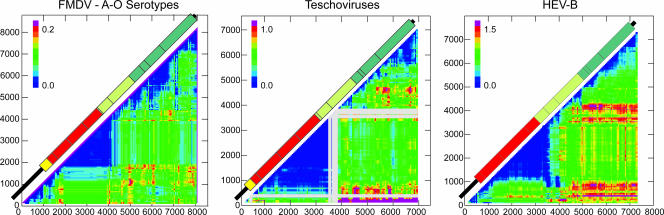
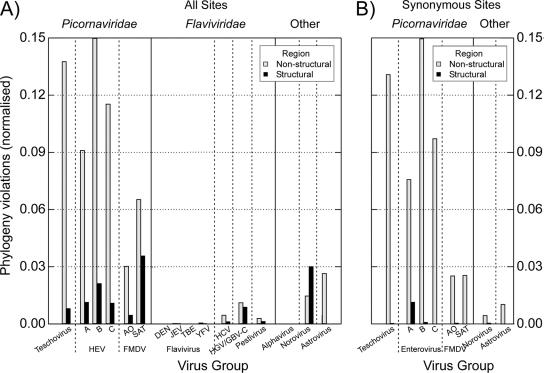
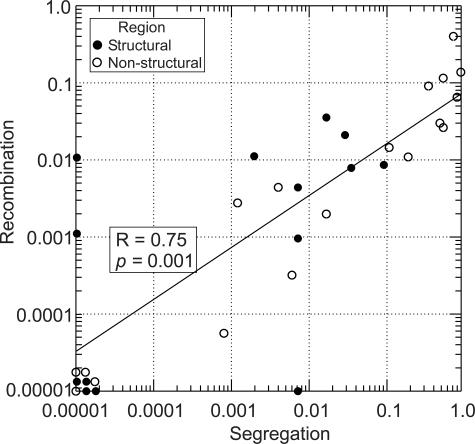
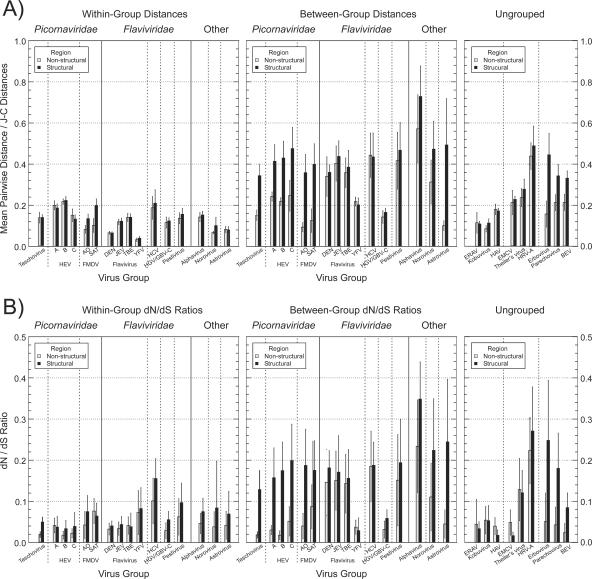
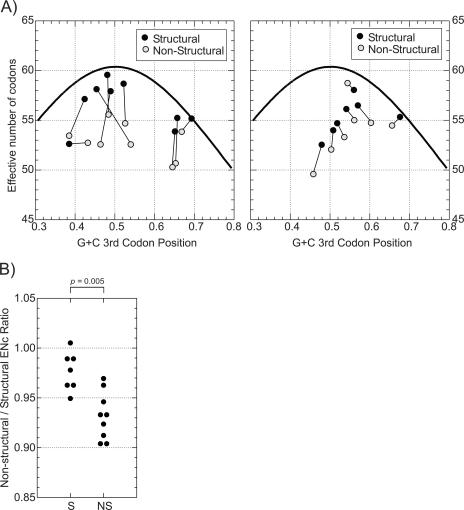
Picornaviridae are a large virus family causing widespread, often pathogenic infections in humans and other mammals. Picornaviruses are genetically and antigenically highly diverse, with evidence for complex evolutionary histories in which recombination plays a major part. To investigate the nature of recombination and selection processes underlying the evolution of serotypes within different picornavirus genera, large-scale analysis of recombination frequencies and sites, segregation by serotype within each genus, and sequence selection and composition was performed, and results were compared with those for other nonenveloped positive-stranded viruses (astroviruses and human noroviruses) and with flavivirus and alphavirus control groups. Enteroviruses, aphthoviruses, and teschoviruses showed phylogenetic segregation by serotype only in the structural region; lack of segregation elsewhere was attributable to extensive interserotype recombination. Nonsegregating viruses also showed several characteristic sequence divergence and composition differences between genome regions that were absent from segregating virus control groups, such as much greater amino acid sequence divergence in the structural region, markedly elevated ratios of nonsynonymous-to-synonymous substitutions, and differences in codon usage. These properties were shared with other picornavirus genera, such as the parechoviruses and erboviruses. The nonenveloped astroviruses and noroviruses similarly showed high frequencies of recombination, evidence for positive selection, and differential codon use in the capsid region, implying similar underlying evolutionary mechanisms and pressures driving serotype differentiation. This process was distinct from more-recent sequence evolution generating diversity within picornavirus serotypes, in which neutral or purifying selection was prominent. Overall, this study identifies common themes in the diversification process generating picornavirus serotypes that contribute to understanding of their evolution and pathogenicity.


Figures

FIG. 1.
FIG. 1.
(A) Ordering (y axis) of variants assigned to different serotypes in phylogenetic trees generated from consecutive 300-base fragments across complete genome sequence alignments of aphthoviruses (left), teschovirus (middle), and human enteroviruses (right). Serotypes are color labeled as follows. For serotypes A to O of FMDV, serotype A is red, B is yellow, C is green, and O is blue; for SAT serotypes, SAT-1 is red, SAT-2 is yellow, and SAT-3 is blue; and for teschoviruses, serogroup 1 is red (serotypes 1, 3, 10, and 11), serogroup 2 is yellow (serotypes 9, 7, and 5), and serogroup 3 is blue (serotypes 6, 2, 4, and 8). For human enteroviruses, the following serotypes were labeled. For HEV-A, enterovirus 71 is red, CAV-16 is blue, and others are yellow; for HEV-B, echovirus 11 is red, echovirus 9 is blue, CBV-5 is yellow, and others are green; for HEV-C, PV1 is red, PV2 is blue, PV3 is green, and others are blue. (B) Segregation scores for consecutive fragments across genomes, where 0 (y axis) represents perfect phylogenetic segregation by assigned group (serotypes) and 1 represents the absence of association between phylogeny and group assignment. Similar results for slightly different sequence subsets of enteroviruses HEV-A to HEV-C have been presented previously (55) and are included for comparison. (C) Mean pair-wise amino acid sequence distances between sequences in consecutive 300-base fragments across the genome. Values are averaged over a window size of 3. Separate mean values were calculated for sequence comparisons within and between groups (pale and dark colors). (D) Genome diagrams of FMDV, teschoviruses, and human enteroviruses drawn to scale and numbered according to the reference sequences NC_011450 for FMDV, PEN011380 for teschoviruses, and POL3L37 for enteroviruses.
FIG. 2.
FIG. 2.
Analysis of sequences for astroviruses, serotypes within three groups of flaviviruses, and alphaviruses (as described for FMDV, teschovirus, and enterovirus sequences shown in Fig. 1; see legend for description). Astroviruses are color labeled as follows: serotype 1 is red, serotype 4 is yellow, and others are blue. TBE-like viruses are labeled as follows: TBE is red, Alkhurma virus is blue, and Powassan virus is yellow. JEV-like viruses are labeled as follows: JEV is red, WNV/Kunjin is blue, and Murray Valley encephalitis virus is yellow. Serotypes 1 to 4 of dengue virus are labeled as red, blue, yellow, and green, respectively. Alphaviruses are labeled as follows: Venezuelan equine encephalitis virus, red; Eastern equine encephalitis virus, blue; Semliki Forest virus, yellow; and Sindbis virus, green. Genome diagrams of astroviruses and alphaviruses were numbered according to the reference sequences NC_001944 and ALSFV42S, respectively. For flaviviruses, a genome diagram of dengue virus (based on the annotation for NC_001477) was included (center, row D). Although not precisely aligned, genome lengths and gene boundaries of the TBE and JEV groups approximated those of NC_001477.
FIG. 3.
FIG. 3.
Phylogenetic compatibility between different genome regions of aphthoviruses, teschoviruses, and HEV-B. Matrices show phylogenetic compatibility scores between trees generated from consecutive 300-base fragments of genome alignments of each virus group. Frequencies of phylogeny violations required to order trees generated from each pair-wise comparison of fragments (x and y axes) were recorded in color (legend), using a 60% bootstrap value to define clades. Phylogenetically compatible regions are shown in deep blue; gray-shaded regions indicate regions of the genome lacking any bootstrap-supported clades. Genome diagrams were aligned with the matrix to enable regions of phylogenetic compatibility to be matched to specific genome regions. For other nonsegregating virus groups, FMDV SAT serotypes produced a matrix similar to that for serotypes A to O (data not shown), while matrices for human enteroviruses HEV-A and HEV-C have been presented elsewhere (55). A similar result for a slightly different sequence subset of HEV-B has been presented previously (55) and is included here for comparison with other picornavirus genera.
FIG. 4.
FIG. 4.
(A) Normalized frequencies of phylogeny violations in structural and nonstructural regions of picornaviruses, flaviviruses, alphaviruses, noroviruses, and astroviruses. Neighbor-joining phylogenetic trees were created from consecutive pair-wise fragments of alignments of each virus group, and violation scores were calculated for each pair-wise comparison, using a bootstrap value of 70% to define clades. Values (y axis) are expressed as calculated frequencies of phylogeny violations in each data set per thousand bases per phylogenetically defined clade (see Materials and Methods for an explanation of the normalization procedure). (B) Repeated analysis using trees constructed from synonymous distance matrices, representing phylogeny violations between clades defined by synonymous site variation.
FIG. 5.
FIG. 5.
Association between segregation values for sero-/genotype categories (x axis) and normalized frequencies of phylogeny violations (y axis) for picornaviruses and other virus groups listed in Table 3. The R value for regression was calculated using the nonparametric Spearman rank correlation coefficient test.
FIG. 6.
FIG. 6.
Mean pair-wise distances (A) and dN/dS ratios (B) of nonsegregating picornaviruses and other virus groups between and within assigned geno-/serogroups (left and middle panels). Corresponding within-group values for other picornavirus genera not analyzed for recombination are shown in the right panels. Bar heights represent mean pair-wise distances and dN/dS ratios of consecutive 300-base fragment sequences within structural and nonstructural regions of each virus group alignment. Error bars show standard deviations between sequence fragments within each region.
FIG. 7.
FIG. 7.
(A) Codon usage (ENc values; y axis) and G+C content at third codon positions (x axis) of structural and nonstructural regions of nonsegregating (left panel) and segregating (right panel) viruses. Nonsegregating viruses were FMDV, HEV-A, HEV-B, HEV-C, teschoviruses, astroviruses, noroviruses, and HGV/GBV-C; segregating viruses were HCV, flavivirus groups, alphaviruses, and pestiviruses. The solid line shows the expected Enc value for random codon usage in sequences for G+C contents ranging from 30% to 80% (x axis). (B) Comparison of ratios of codon usage between nonstructural and structural regions of segregating (S) and nonsegregating (NS) virus groups.

Similar articles

Cited by

References

    1. Ambert-Balay, K., F. Bon, F. Le Guyader, P. Pothier, and E. Kohli. 2005. Characterization of new recombinant noroviruses. J. Clin. Microbiol. 43:5179-5186. - PMC - PubMed
    1. Andersson, P., K. Edman, and A. M. Lindberg. 2002. Molecular analysis of the echovirus 18 prototype: evidence of interserotypic recombination with echovirus 9. Virus Res. 85:71-83. - PubMed
    1. Ando, T., J. S. Noel, and R. L. Fankhauser. 2000. Genetic classification of “Norwalk-like viruses.” J. Infect. Dis. 181(Suppl. 2):S336-S348. - PubMed
    1. Baranowski, E., C. M. Ruiz-Jarabo, and E. Domingo. 2001. Evolution of cell recognition by viruses. Science 292:1102-1105. - PubMed
    1. Belliot, G., H. Laveran, and S. S. Monroe. 1997. Detection and genetic differentiation of human astroviruses: phylogenetic grouping varies by coding region. Arch. Virol. 142:1323-1334. - PubMed

LinkOut - more resources