. 2006 Sep 6;26(36):9239-49.
doi: 10.1523/JNEUROSCI.1898-06.2006.

Integration of exogenous input into a dynamic salience map revealed by perturbing attention

Affiliations

Integration of exogenous input into a dynamic salience map revealed by perturbing attention

Puiu F Balan et al. J Neurosci. .

Abstract

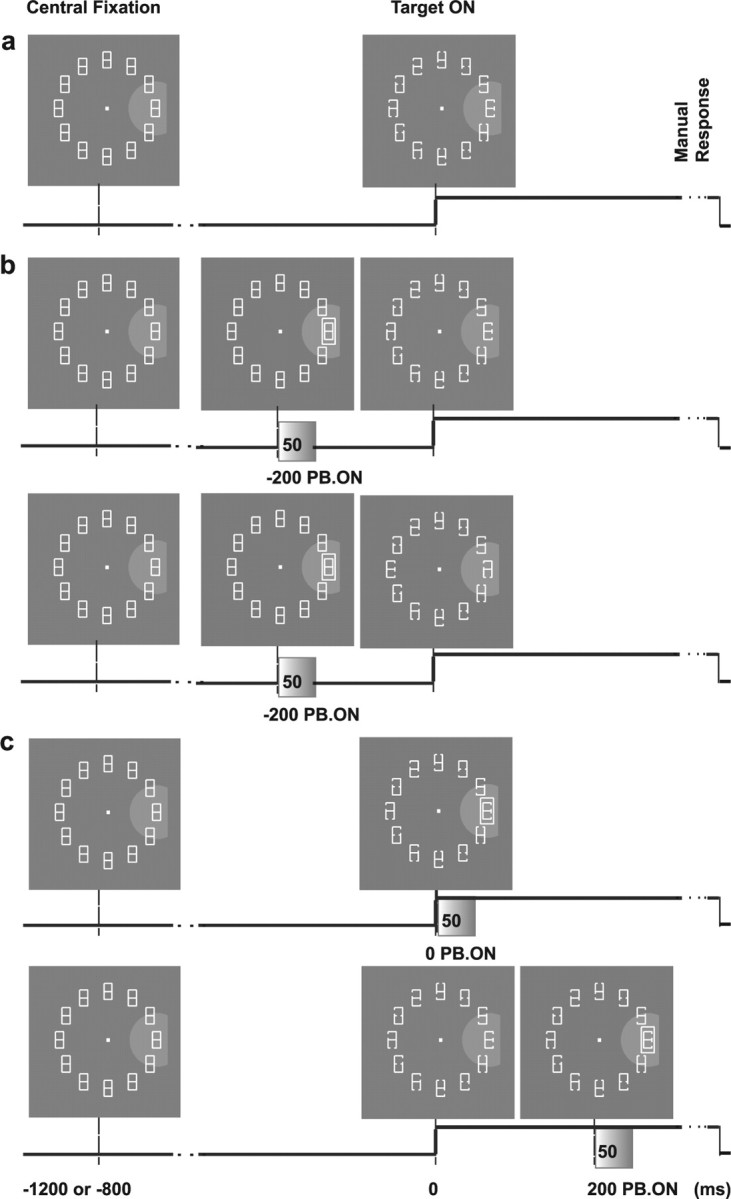
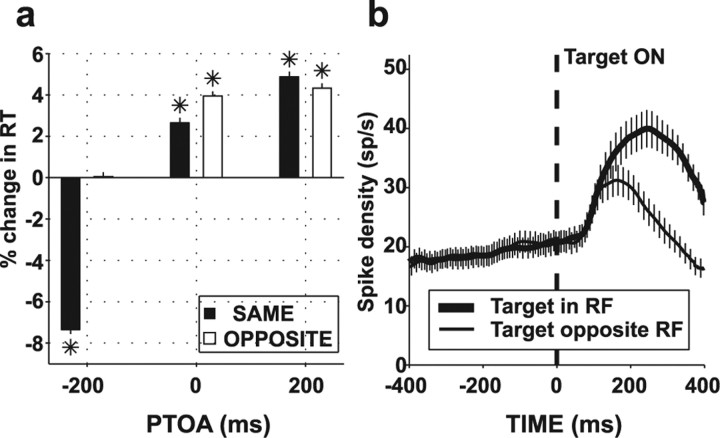
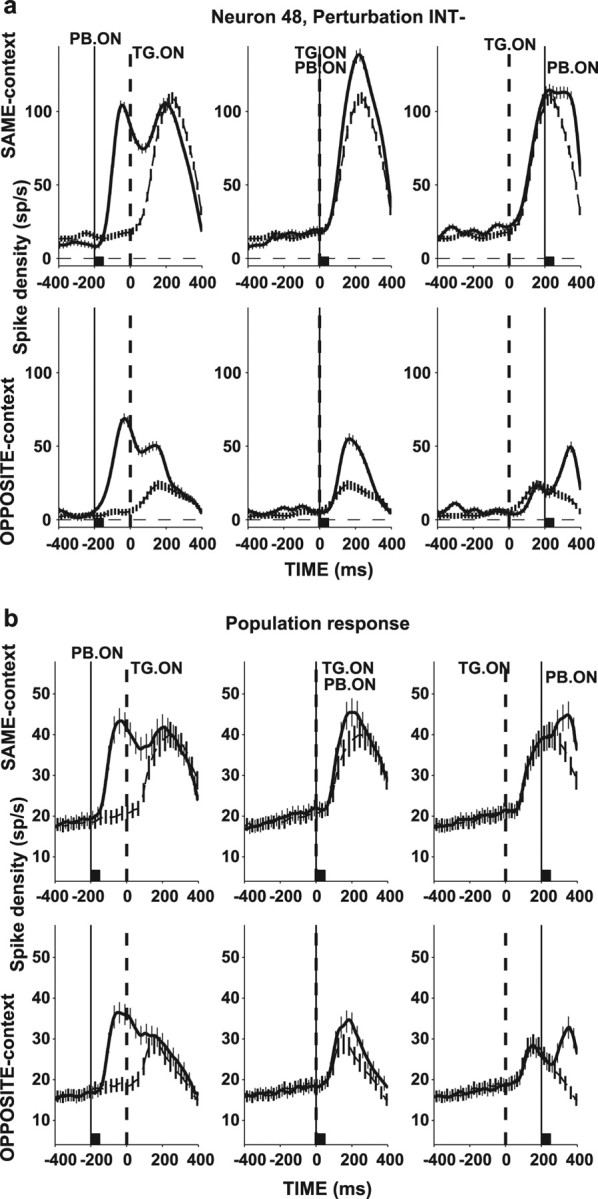
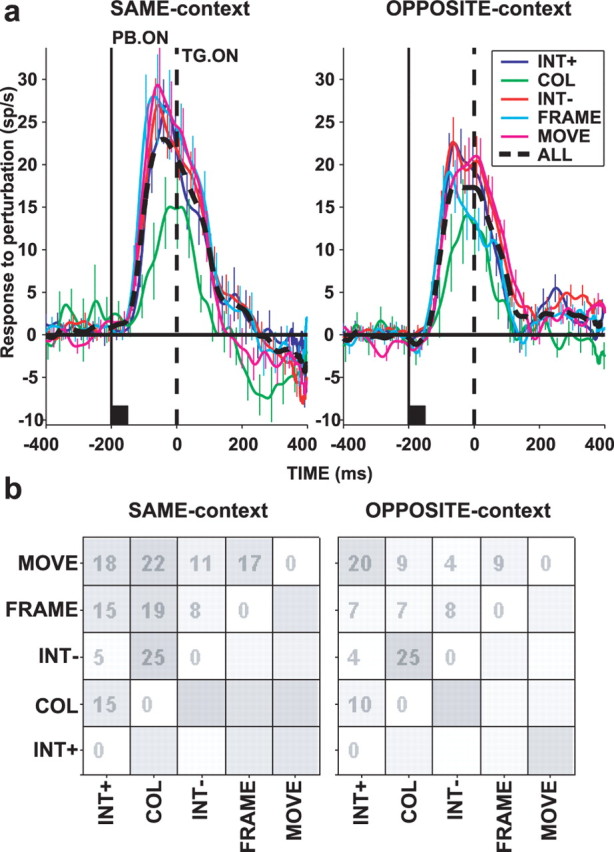
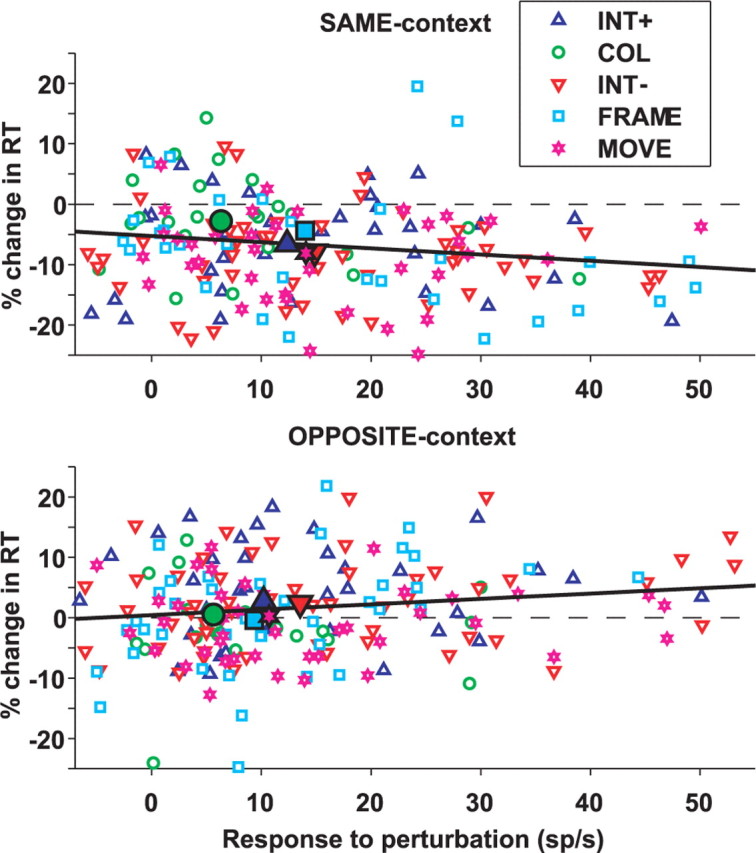
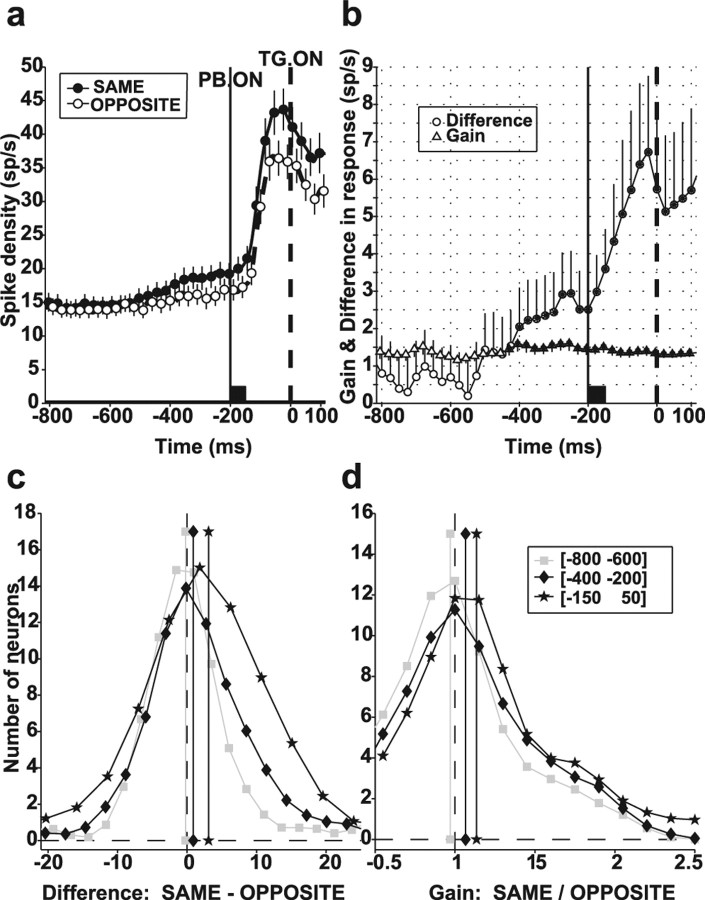
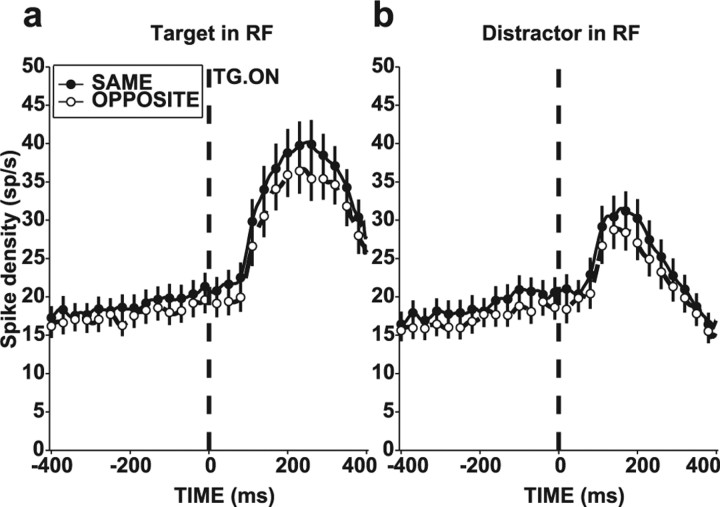
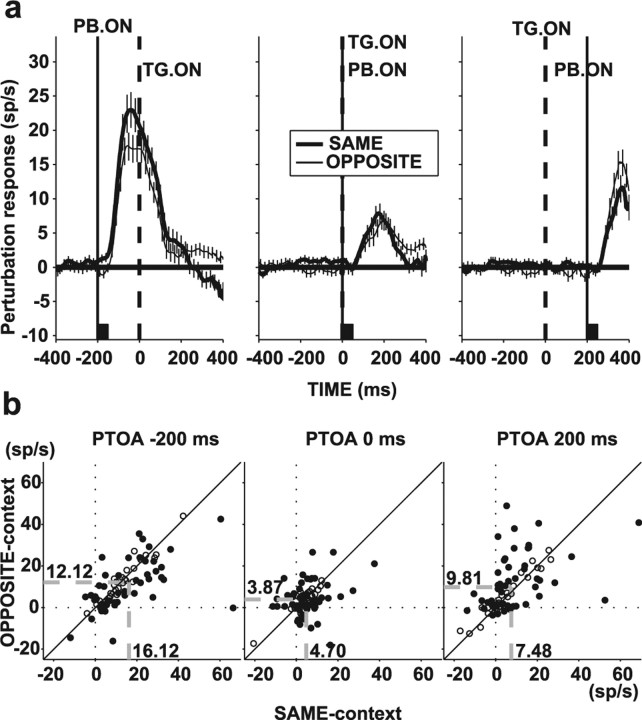
Although it is widely accepted that exogenous and voluntary factors jointly determine the locus of attention, the rules governing the integration of these factors are poorly understood. We investigated neural responses in the lateral intraparietal area (LIP) to transient, distracting visual perturbations presented during task performance. Monkeys performed a covert search task in which they discriminated the orientation of a target embedded among distractors, and brief visual perturbations were presented at various moments and locations during task performance. LIP neurons responded to perturbations consisting of the appearance of new objects, as well as to abrupt changes in the color, luminance, or position of existing objects. The LIP response correlated with the bottom-up behavioral effects of different perturbation types. In addition, neurons showed two types of top-down modulations. One modulation was a context-specific multiplicative gain that affected perturbation, target, and distractor activity in a spatially nonspecific manner. Gain was higher in blocks of trials in which perturbations directly marked target location than in blocks in which they invariably appeared opposite the target, thus encoding a behavioral context defined by the statistical contingency between target and perturbation location. A second modulation reflected local competitive interactions with search-related activity, resulting in the converse effect: weaker perturbation-evoked responses if perturbations appeared at the location of the target than if they appeared opposite the target. Thus, LIP encodes an abstract dimension of salience, which is shaped by local and global top-down mechanisms. These interacting mechanisms regulate responsiveness to external input as a function of behavioral context and momentary task demands.


Figures

Figure 1.
Figure 1.
Behavioral task. a, Visual search without perturbation (25% of trials). The placeholder display is constantly on in the intertrial interval. To begin each trial, the monkey must fixate the central dot for a variable interval (1200 or 800 ms). In so doing, the monkey brings the RF of the neuron (gray semicircle) onto one of the display elements. The target display is revealed at time 0 (Target ON) by partial removal of two line segments, and the monkey must indicate the orientation of the E-shaped target by releasing one response bar (Manual Response). b, Perturbation trials for the SAME context (top row) and the OPPOSITE context (bottom row) when the perturbation (FRAME) appears 200 ms before the target (PB. ON; PTOA of −200 ms) in RF. The perturbation is always presented for 50 ms and then turned off. c, Trials in which the perturbation (FRAME) appeared at 0 ms (top row) and 200 ms (bottom row) PTOA in RF for the SAME context. In all trials, the placeholder display is restored 300 ms after the manual response.
Figure 2.
Figure 2.
Average change in RT and search-related activity in no-perturbation trials. a, Average and SE of percentage change in RT in trials with (RTPB) relative to those without perturbations (RTNOPB) [(RTPB − RTNOPB)/RTNOPB], where RT is the average reaction time in each condition for each context and PTOA. *p < 0.01 relative to 0 (t test). b, Population neuronal responses on no-perturbation trials in the SAME condition (average and SE) when either the target or a distractor were in the RF.
Figure 3.
Figure 3.
Superposition of search and perturbation-related responses. a, Responses (mean and SE) of a representative neuron for trials in which the perturbation was in the RF (thick traces) and for the corresponding no-perturbation trials (thin dashed traces). Top row shows responses for the SAME context, and bottom row shows responses in the OPPOSITE context, for PTOAs of −200 ms (left), 0 ms (middle), and 200 ms (right). Traces are aligned with target onset (time 0, broken vertical line), and the time of perturbation (INT−) onset is marked with the solid vertical line. The back squares mark the perturbation lifetime. b, Population responses, averaged across all neurons and perturbation types. Same format as in a. TG. ON, Target onset; PB. ON, perturbation onset.
Figure 4.
Figure 4.
Responses to each perturbation type. a, Population response to perturbations (difference between response on trials with and without perturbation) for PTOA of −200 ms, SAME context (left) and OPPOSITE context (right). The black squares mark the perturbation lifetime. The different types of perturbations are designated as follows: INT+, increase in luminance; INT−, decrease in luminance; COL, color change; MOVE, back-and-forth radial movement; FRAME, appearance of frame surrounding one pattern; ALL, all perturbations together. b, Gray map representing the similarity matrices for SAME context (left) and OPPOSITE context (right). Numbers show the percentage of neurons with statistically significant different responses for each perturbation pair (Kruskal–Wallis ANOVA on perturbation responses 50–250 ms after perturbation onset followed by multiple pairwise comparisons). We used a liberal criterion of 0.05 to ensure that we did not miss any differences that may have occurred. TG. ON, Target onset; PB. ON, perturbation onset.
Figure 5.
Figure 5.
Correlation between the fractional change in RT and the response to the perturbation. Each point represents the fractional change in RT (as defined in Fig. 2) and average response to a specific perturbation (difference between average firing rate on perturbation and no-perturbation trials, 50–250 ms after perturbation onset) for one neuron, at −200 ms PTOA, in the SAME (top row) and OPPOSITE (bottom row) contexts. The color coding is the same as in Figure 4. Filled symbols show medians for each perturbation type, and thick lines represent the linear regression through all data points.
Figure 6.
Figure 6.
Quantitative analysis of contextual effect. a, Population responses (mean and SE) for −200 ms PTOA in the SAME and OPPOSITE contexts. Traces show the presearch fixation epoch and the perturbation response and are truncated 100 ms after target presentation, when neurons began reflecting the presence of the target or a distractor in the RF. b, Average difference (circles) and ratio (triangles) between neural response in the SAME and OPPOSITE contexts, for the responses in a. Values were calculated in a sliding window (50 ms width, 25 ms step), separately for each neuron and then averaged across the population. Error bars show SE, and asterisks indicate values significantly different from 0 (for difference) or 1 (for ratio; both Wilcoxon’s test, p < 0.05). c, Distribution of the difference in firing rates between SAME and OPPOSITE contexts for PTOA of −200 ms in individual neurons. d, Distribution of the ratio between responses in SAME and OPPOSITE contexts for PTOA of −200 ms. Vertical lines and symbols show medians for the corresponding histogram. TG. ON, Target onset; PB. ON, perturbation onset.
Figure 7.
Figure 7.
Contextual effect in trials without perturbation. Population responses for the SAME and OPPOSITE contexts when the target was in the RF (a) and when a distractor was in the RF (b). Same format as in Figure 6a. Traces are aligned on time of target presentation (TG. ON).
Figure 8.
Figure 8.
Quantitative analysis of timing effect. a, Perturbation-evoked component of the response, obtained by subtracting response on trials with and without perturbation. The subtraction was calculated separately for each neuron, and resulting traces were averaged across neurons. Thick traces represent responses for the SAME context, and thin traces represent responses for the OPPOSITE context. The two traces in the left panel (−200 ms PTOA) are the same as the black dashed traces in the SAME and OPPOSITE contexts in Figure 4a. b, Scatter plots of perturbation component of the response in the SAME versus the OPPOSITE context for PTOA of −200 ms (left), 0 ms (middle), and 200 ms (right). Filled symbols represent neurons with a statistically significant effect of context. The dashed gray lines and the associated numbers represent the center of mass coordinates. Diagonal line is the equality line. TG. ON, Target onset; PB. ON, perturbation onset.

Comment in

References

    1. Barash S, Bracewell RM, Fogassi L, Gnadt JW, Andersen RA. Saccade-related activity in the lateral intraparietal area. I. Temporal properties. J Neurophysiol. 1991;66:1095–1108. - PubMed
    1. Bisley JW, Goldberg ME. Neuronal activity in the lateral intraparietal area and spatial attention. Science. 2003;299:81–86. - PubMed
    1. Bisley JW, Krishna BS, Goldberg ME. A rapid and precise on-response in posterior parietal cortex. J Neurosci. 2004;24:1833–1838. - PMC - PubMed
    1. Bowman EM, Brown VJ, Kertzman C, Schwarz U, Robinson DL. Covert orienting of attention in macaques. I. Effects of behavioral context. J Neurophysiol. 1993;70:431–443. - PubMed
    1. Chastain G, Cheal M. Attentional capture with various distractor and target types. Percept Psychophys. 2001;63:979–990. - PubMed

Publication types