Fiber-optic microarray for simultaneous detection of multiple harmful algal bloom species
- PMID: 16957189
- PMCID: PMC1563625
- DOI: 10.1128/AEM.00332-06
Fiber-optic microarray for simultaneous detection of multiple harmful algal bloom species
Abstract
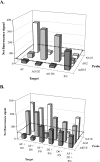
Harmful algal blooms (HABs) are a serious threat to coastal resources, causing a variety of impacts on public health, regional economies, and ecosystems. Plankton analysis is a valuable component of many HAB monitoring and research programs, but the diversity of plankton poses a problem in discriminating toxic from nontoxic species using conventional detection methods. Here we describe a sensitive and specific sandwich hybridization assay that combines fiber-optic microarrays with oligonucleotide probes to detect and enumerate the HAB species Alexandrium fundyense, Alexandrium ostenfeldii, and Pseudo-nitzschia australis. Microarrays were prepared by loading oligonucleotide probe-coupled microspheres (diameter, 3 mum) onto the distal ends of chemically etched imaging fiber bundles. Hybridization of target rRNA from HAB cells to immobilized probes on the microspheres was visualized using Cy3-labeled secondary probes in a sandwich-type assay format. We applied these microarrays to the detection and enumeration of HAB cells in both cultured and field samples. Our study demonstrated a detection limit of approximately 5 cells for all three target organisms within 45 min, without a separate amplification step, in both sample types. We also developed a multiplexed microarray to detect the three HAB species simultaneously, which successfully detected the target organisms, alone and in combination, without cross-reactivity. Our study suggests that fiber-optic microarrays can be used for rapid and sensitive detection and potential enumeration of HAB species in the environment.
Figures


References
-
- Adachi, M., Y. Sako, and Y. Ishida. 1996. Identification of the toxic dinoflagellates Alexandrium catenella and A. tamarense (Dinophyceae) using DNA probes and whole-cell hybridization. J. Phycol. 32:1049-1052.
-
- Ahn, S., and D. R. Walt. 2005. Detection of Salmonella spp. using microsphere-based, fiber-optic DNA microarrays. Anal. Chem. 77:5041-5047. - PubMed
-
- Anderson, D. M. 1994. Red tides. Sci. Am. 271:62-68. - PubMed
-
- Anderson, D. M. 1997. Turning back the harmful red tide. Nature 388:513.
-
- Anderson, D. M., D. M. Kulis, and B. A. Keafer. 1999. Detection of the toxic dinoflagellate Alexandrium fundyense (Dynophyceae) with oligonucleotide and antibody probes: variability in labeling intensity with physiological condition. J. Phycol. 35:870-883.
Publication types
MeSH terms
Substances
LinkOut - more resources
Full Text Sources
Other Literature Sources

