. 2006 Sep;72(9):6101-10.
doi: 10.1128/AEM.01058-06.

Detection of microcystin-producing cyanobacteria in Finnish lakes with genus-specific microcystin synthetase gene E (mcyE) PCR and associations with environmental factors

Affiliations

Detection of microcystin-producing cyanobacteria in Finnish lakes with genus-specific microcystin synthetase gene E (mcyE) PCR and associations with environmental factors

Anne Rantala et al. Appl Environ Microbiol. 2006 Sep.

Abstract

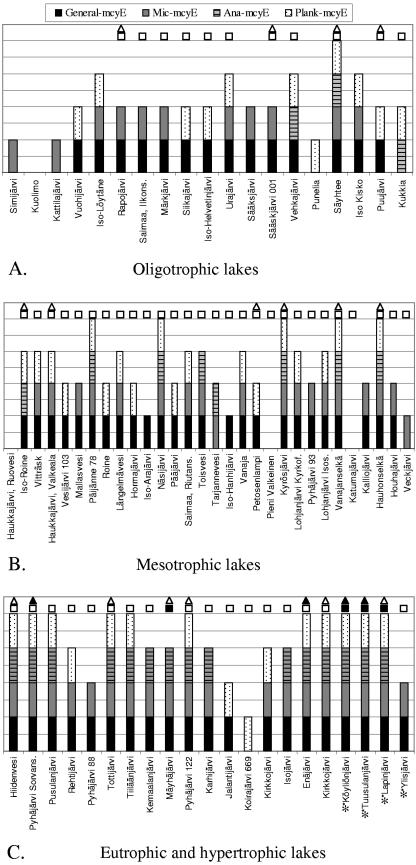
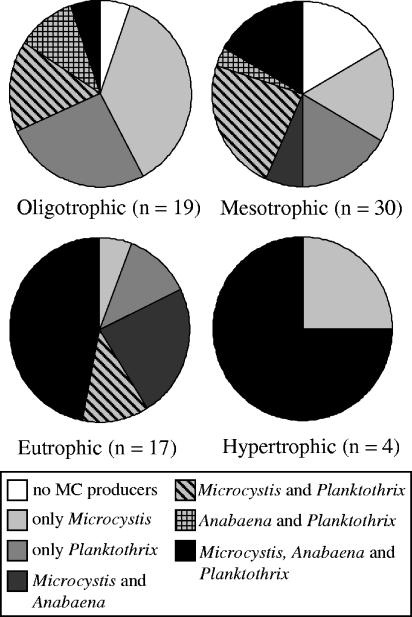
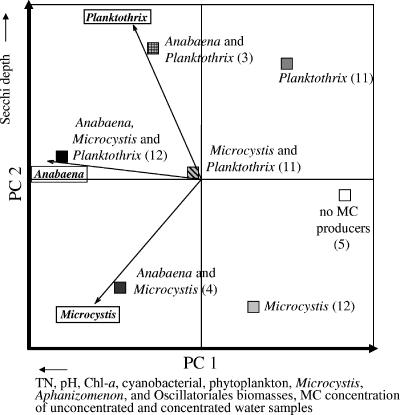
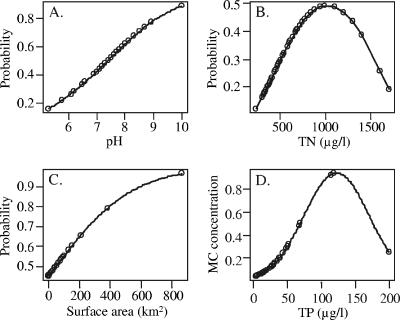
We studied the frequency and composition of potential microcystin (MC) producers in 70 Finnish lakes with general and genus-specific microcystin synthetase gene E (mcyE) PCR. Potential MC-producing Microcystis, Planktothrixand Anabaena spp. existed in 70%, 63%, and 37% of the lake samples, respectively. Approximately two-thirds of the lake samples contained one or two potential MC producers, while all three genera existed in 24% of the samples. In oligotrophic lakes, the occurrence of only one MC producer was most common. The combination of Microcystis and Planktothrix was slightly more prevalent than others in mesotrophic lakes, and the cooccurrence of all three MC producers was most widespread in both eutrophic and hypertrophic lakes. The proportion of the three-producer lakes increased with the trophic status of the lakes. In correlation analysis, the presence of multiple MC-producing genera was associated with higher cyanobacterial and phytoplankton biomass, pH, chlorophyll a, total nitrogen, and MC concentrations. Total nitrogen, pH, and the surface area of the lake predicted the occurrence probability of mcyE genes, whereas total phosphorus alone accounted for MC concentrations in the samples by logistic and linear regression analyses. In conclusion, the results suggested that eutrophication increased the cooccurrence of potentially MC-producing cyanobacterial genera, raising the risk of toxic-bloom formation.


Figures

FIG. 1.
FIG. 1.
PCR results of 70 Finnish lakes with general mcyE and Microcystis-, Anabaena-, and Planktothrix-specific mcyE primer pairs. (A) Oligotrophic lakes (n = 19), with a TP concentration of <10 μg/liter. (B) Mesotrophic lakes (n = 30), with a TP concentration 10 to 34 μg/liter. (C) Eutrophic (n = 17) and hypertrophic (n = 4) lakes, with TP concentrations of 35 to 100 μg/liter and >100 μg/liter, respectively. Hypertrophic lakes are marked with an asterisk. Lakes are marked with white squares and triangles if MCs were detected with ELISA in concentrated and unconcentrated samples and with black squares and triangles if MC concentrations of concentrated and unconcentrated samples exceeded 1 μg/liter, respectively.
FIG. 2.
FIG. 2.
Proportion of lakes with different combinations of potential MC producers, Anabaena, Microcystis, and Planktothrix, based on the presence of genus-specific mcyE genes in oligotrophic (TP, <10 μg/liter), mesotrophic (TP, 10 to 34 μg/liter), eutrophic (TP, 35 to 100 μg/liter), and hypertrophic (TP, >100 μg/liter) lakes.
FIG. 3.
FIG. 3.
PCA ordination of the lake samples (n = 58) based on the mcyE PCR results (presence/absence) with Anabaena-, Microcystis-, and Planktothrix-specific primers. The different PCRs are indicated with string vectors, and the specificity of the PCR is indicated with a boxed genus name. Squares indicate positions of the lake groups, which have different combinations of mcyE genes. The number of lakes belonging to each group is in parentheses. Environmental variables correlating significantly with PC axis 1 and the most significant variable correlating with PC axis 2 are indicated with arrows showing the direction of correlation below or beside the corresponding axis. PC axes 1 and 2 explained 42.4% and 38.1% of the variation, respectively.
FIG. 4.
FIG. 4.
Estimated occurrence probability of the mcyE genes based on the logistic regression model parameters pH (A), TN (B), and the surface area of a lake (C) and on the estimated MC concentrations (μg/liter) based on linear regression model parameter TP (D). The effects of the other parameters were removed in the case of the logistic regression model (A to C) to reveal the subjective forms of response.

References

    1. Carmichael, W. W. 1994. The toxins of cyanobacteria. Sci. Am. 270:78-86. - PubMed
    1. Christiansen, G., J. Fastner, M. Erhard, T. Börner, and E. Dittmann. 2003. Microcystin biosynthesis in Planktothrix: genes, evolution, and manipulation. J. Bacteriol. 185:564-572. - PMC - PubMed
    1. Christiansen, G., R. Kurmayer, Q. Liu, and T. Börner. 2006. Transposons inactivate biosynthesis of the nonribosomal peptide microcystin in naturally occurring Planktothrix spp. Appl. Environ. Microbiol. 72:117-123. - PMC - PubMed
    1. Dittmann, E., and T. Börner. 2005. Genetic contributions to the risk assessment of microcystin in the environment. Toxicol. Appl. Pharmacol. 203:192-200. - PubMed
    1. Dittmann, E., B. A. Neilan, M. Erhard, H. von Döhren, and T. Börner. 1997. Insertional mutagenesis of a peptide synthetase gene that is responsible for microcystin production in the cyanobacterium Microcystis aeruginosa PCC 7806. Mol. Microbiol. 26:779-787. - PubMed

Publication types

MeSH terms

LinkOut - more resources