. 2006 Sep;72(9):6277-87.
doi: 10.1128/AEM.00614-06.

Assessment of genes associated with Streptococcus mutans biofilm morphology

Affiliations

Assessment of genes associated with Streptococcus mutans biofilm morphology

Mizuho Motegi et al. Appl Environ Microbiol. 2006 Sep.

Abstract

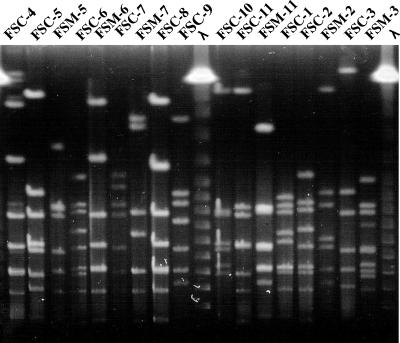
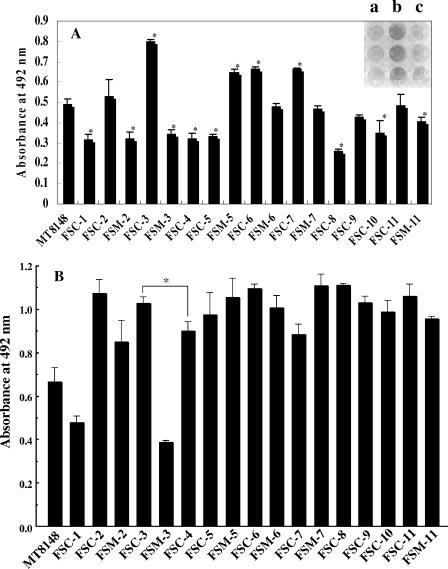
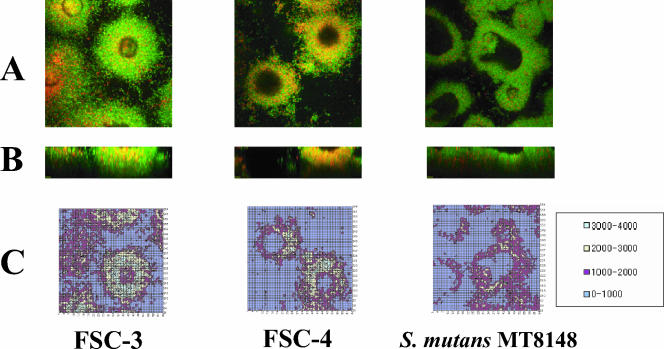
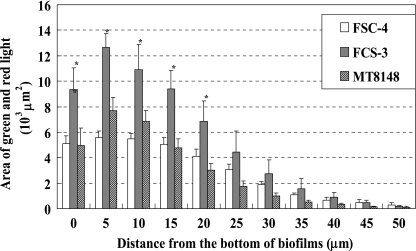
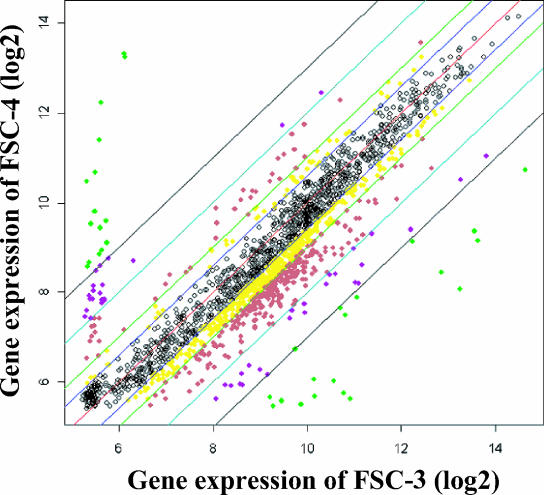
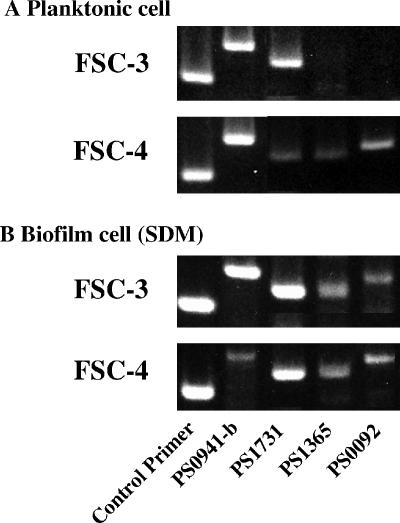
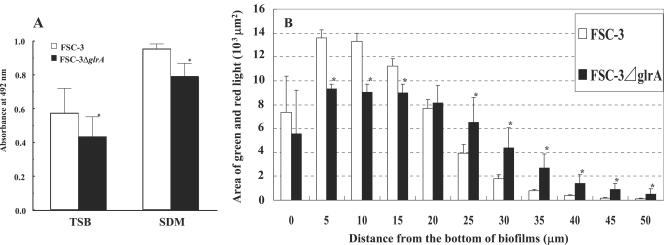
Streptococcus mutans, the major pathogen responsible for dental caries in humans, is a biofilm-forming bacterium. In the present study, 17 different pulsed-field gel electrophoresis patterns of genomic DNA were identified in S. mutans organisms isolated clinically from whole saliva. The S. mutans isolates showed different abilities to form biofilms on polystyrene surfaces in semidefined minimal medium cultures. Following cultivation in a flow cell system in tryptic soy broth with 0.25% sucrose and staining using a BacLight LIVE/DEAD system, two strains, designated FSC-3 and FSC-4, showed the greatest and least, respectively, levels of biofilm formation when examined with confocal laser scanning microscopy. Further, image analyses of spatial distribution and architecture were performed to quantify the merged green (live cells) and red (dead cells) light. The light intensity of the FSC-3 biofilm was greater than that of the FSC-4 biofilm in the bottom area but not in the top area. S. mutans whole-genome array results showed that approximately 3.8% of the genes were differentially expressed in the two strains, of which approximately 2.2%, including bacitracin transport ATP-binding protein gene glrA and a BLpL-like putative immunity protein gene, were activated in FSC-3. In addition, about 1.6% of the genes, including those associated with phosphotransferase system genes, were repressed. Analyses of the glrA-deficient strains and reverse transcription-PCR confirmed the role of the gene in biofilm formation. Differential assessment of biofilm-associated genes in clinical strains may provide useful information for understanding the morphological development of streptococcal biofilm, as well as for colonization of S. mutans.


Figures

FIG. 1.
FIG. 1.
PFGE patterns of genomic DNA from S. mutans isolates. At least 17 different PFGE patterns were found in the paired samples from mothers and children. NotI was used for digestion. λ, lambda DNA ladder molecular size standards; FSC, strain from child; FSM, strain from mother; 1 to 11, subject numbers. FSC and FSM strains with the same number are child-mother pairs. The data shown are representative of three independent experiments.
FIG. 2.
FIG. 2.
Biofilm formation by 17 S. mutans genotypes. Graphs show quantification of biofilms formed after 16 h of culture in SDM (A) and TSB (B). The upper right photograph shows typical biofilms grown on polystyrene microtiter plates (a, FSM-2; b, FSC-3; c, FSM-3). The results are expressed as the means ± standard deviations from three independent assays. MT8148, S. mutans MT8148. Asterisks denote significantly different (P < 0.05) relative levels of biofilm formation (A, other clinical strains versus MT8148; B, FSC-3 versus FSC-4).
FIG. 3.
FIG. 3.
(A) CLSM images showing xy planes (141.145 μm by 141.145 μm) of the biofilm bottom area. Viable cells are colored green, and nonviable cells are colored red. (B) CLSM images showing xz planes (141.145 μm by 50.0 μm) recorded from the center of a single biofilm shown in panel A. (C) Two-dimensional contour map generated from the CLSM image shown in panel A. As a control, S. mutans MT8148 organisms were analyzed. Light intensities were divided into four color groups as shown in the box. The data are representative of three independent experiments.
FIG. 4.
FIG. 4.
Quantification of merged light areas of green and red in xy planes of CLSM images. Each biofilm was scanned at five randomly selected positions. Data are representative of three independent experiments. The results are expressed as the means ± standard deviations of triplicate assays. Asterisks denote significantly different relative levels of biofilm formation (P < 0.05; versus MT8148).
FIG. 5.
FIG. 5.
Scatter plot showing intensities of the spots on an S. mutans microarray. Each gene expression was normalized using the robust multichip average, estimates of which were based on a robust average of log2 [B(PM)], where B(PM) represented background corrected PM (perfect match) intensities. Black dots, genes that showed less than 1.5-fold regulation; yellow dots, 1.5- to 2.0-fold; red dots, 2.0- to 4.0-fold; violet dots, 4.0- to 8.0-fold; green dots, more than 8.0-fold.
FIG. 6.
FIG. 6.
RT-PCR analyses of biofilm and planktonic cells from S. mutans clinical strains. For FSC-3 and -4, we used the primers PS0941-b, PS1731, PS1365, and PS0092 to amplify the target genes described in Table 1. A control primer was used to normalize the expression of the test genes. Total bacterial RNA was isolated from biofilm and planktonic samples, and RT-PCR was performed as described in Materials and Methods. The data shown are representative of two independent assays.
FIG. 7.
FIG. 7.
Biofilm formation by FSC-3 ΔglrA and FSC-3. (A) Quantification of biofilm after 16 h of culture in TSB and SDM in 96-well microtiter plates. The results are expressed as the means ± standard deviations from three independent assays. (B) Quantification of biofilm after 20 h of culture in TSB using the flow cell system and fluorescence area in xy planes of CLSM images. Each biofilm was scanned at five randomly selected positions. The results are expressed as the means ± standard deviations from three independent assays. Asterisks denote significantly different relative levels of biofilm formation (P < 0.05; versus FSC-3).

References

    1. Ajdic, D., W. M. McShan, R. E. McLaughlin, G. Savic, J. Chang, M. B. Carson, C. Primeaux, R. Tian, S. Kenton, H. Jia, S. Lin, Y. Qian, S. Li, H. Zhu, F. Najar, H. Lai, J. White, B. A. Roe, and J. J. Ferretti. 2002. Genome sequence of Streptococcus mutans UA159, a cariogenic dental pathogen. Proc. Natl. Acad. Sci. USA 99:14434-14439. - PMC - PubMed
    1. Auschill, T. M., N. B. Arweiler, L. Netuschil, M. Brecx, E. Reich, and A. Sculean. 2001. Spatial distribution of vital and dead microorganisms in dental biofilms. Arch. Oral Biol. 46:471-476. - PubMed
    1. Berkowitz, R. J., and H. V. Jordan. 1975. Similarity of bacteriocins of Streptococcus mutans from mother and infant. Arch. Oral Biol. 20:725-730. - PubMed
    1. Bhagwat, S. P., J. Nary, and R. A. Burne. 2001. Effects of mutating putative two-component systems on biofilm formation by Streptococcus mutans UA159. FEMS Microbiol. Lett. 205:225-230. - PubMed
    1. Bolstad, B., R. Irizarry, M. Astrand, and T. Speed. 2003. A comparison of normalization methods for high density oligonucleotide array data based on bias and variance. Bioinfomatics 19:185-193. - PubMed

Publication types

MeSH terms

LinkOut - more resources