

Identifying genes that contribute most to good classification in microarrays
- PMID: 16959042
- PMCID: PMC1574352
- DOI: 10.1186/1471-2105-7-407
Identifying genes that contribute most to good classification in microarrays
Abstract
Background: The goal of most microarray studies is either the identification of genes that are most differentially expressed or the creation of a good classification rule. The disadvantage of the former is that it ignores the importance of gene interactions; the disadvantage of the latter is that it often does not provide a sufficient focus for further investigation because many genes may be included by chance. Our strategy is to search for classification rules that perform well with few genes and, if they are found, identify genes that occur relatively frequently under multiple random validation (random splits into training and test samples).
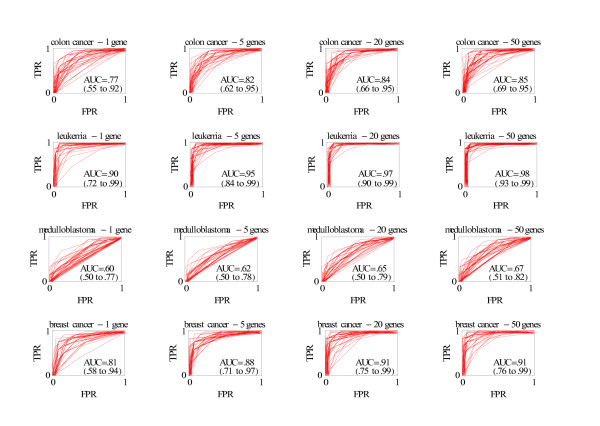
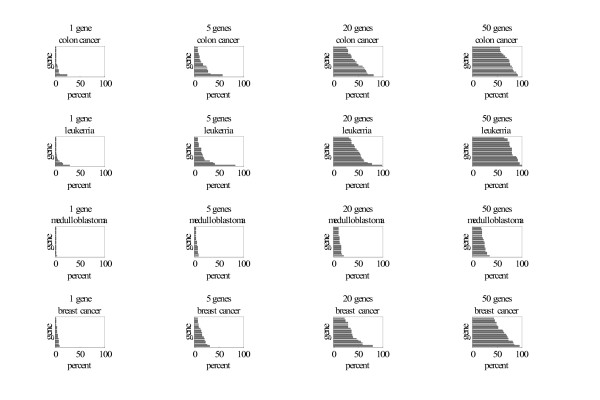
Results: We analyzed data from four published studies related to cancer. For classification we used a filter with a nearest centroid rule that is easy to implement and has been previously shown to perform well. To comprehensively measure classification performance we used receiver operating characteristic curves. In the three data sets with good classification performance, the classification rules for 5 genes were only slightly worse than for 20 or 50 genes and somewhat better than for 1 gene. In two of these data sets, one or two genes had relatively high frequencies not noticeable with rules involving 20 or 50 genes: desmin for classifying colon cancer versus normal tissue; and zyxin and secretory granule proteoglycan genes for classifying two types of leukemia.
Conclusion: Using multiple random validation, investigators should look for classification rules that perform well with few genes and select, for further study, genes with relatively high frequencies of occurrence in these classification rules.
Figures
References
-
- Dudoit S, Fridlyand J, Speed TP. Comparison of discrimination methods for the classification of tumors using gene expression data. J Am Stat Assoc. 2002;97:77–87. doi: 10.1198/016214502753479248. - DOI
MeSH terms
Substances
LinkOut - more resources
Full Text Sources
Other Literature Sources
Miscellaneous
