Immunoglobulin G, A, and M responses to BK virus in renal transplantation
- PMID: 16960119
- PMCID: PMC1563576
- DOI: 10.1128/CVI.00114-06
Immunoglobulin G, A, and M responses to BK virus in renal transplantation
Abstract
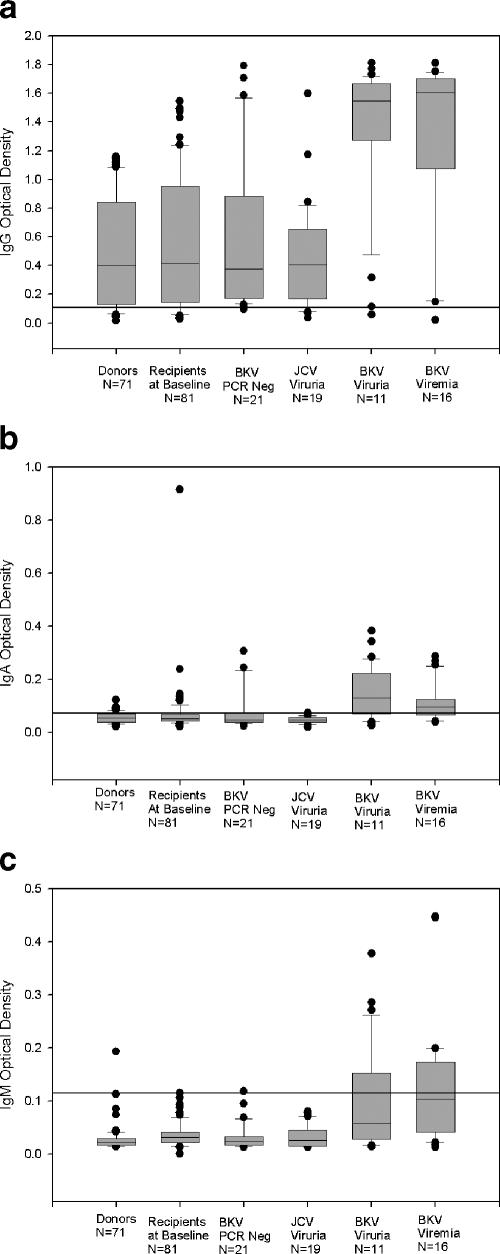
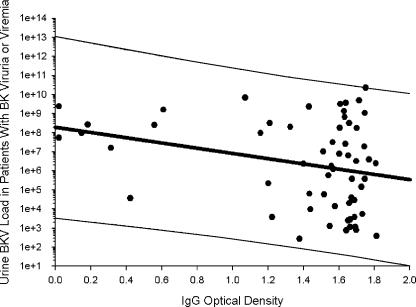
Immunoglobulin G (IgG), IgA, and IgM antibodies were measured in serum samples from 71 organ donors, 81 kidney transplant recipients at transplantation, and 67 patients during the posttransplant period by using a virus-like particle-based enzyme-linked immunosorbent assay (ELISA). BK virus (BKV) and JC virus DNA were detected in urine and plasma by real-time PCR. IgG antibodies to BKV were demonstrated in the majority (80.3 to 100%) of patients irrespective of clinical category, but titers were highest in patients with active viral replication. IgA antibodies were present with greater frequency (72.7 to 81.3% versus 0 to 23.6%; P < 0.001) and higher titer (mean optical density, 0.11 to 0.15 versus 0.05 to 0.08; P < 0.001) in patients who were BKV DNA positive than those who were BKV DNA negative. IgM antibodies showed a similar pattern of reactivity but lower frequency in the setting of active viral replication (9.1 to 43.7% versus 0 to 1.4%; P < 0.001). A rise in IgG level of >0.577 optical density (OD) units or a rise in IgA or IgM level of >0.041 OD units was strongly associated with active viral replication. Urine viral load showed a positive correlation with IgM titer (r = 0.22) but a negative correlation with IgG titer (r = -0.28) and IgA titer (r = -0.1). Chronic dialysis patients typically did not have serologic or virologic evidence of active BKV infection. Anti-BKV titers did not rise in patients with JC viruria. In conclusion, measurement of anti-BKV antibody titer and class response can be used to detect the onset of viral replication. ELISAs can be quite specific despite considerable sequence homology between BK virus and JC virus.
Figures
References
-
- Bodeus, M., F. Smets, R. Reding, E. Sokal, J. B. Otte, P. Goubau, and L. van Renterghem. 1999. Epstein-Barr virus infection in sixty pediatric liver graft recipients: diagnosis of primary infection and virologic follow-up. Pediatr. Infect. Dis. J. 18:698-702. - PubMed
-
- Bohl, D. L., G. Storch, C. Ryschkewitsch, M. Gaudreault-Keener, M. Schnitzler, E. O. Major, and D. C. Brennan. 2005. Donor origin of BK virus in renal transplantation and role of HLA C7 in susceptibility to sustained BK viremia. Am. J. Transplant. 5:2213-2221. - PubMed
-
- Bohl, D. L., C. Ryschkewitsch, E. O. Major, G. A. Storch, and D. C. Brennan. 2005. BK virus antibody titers markedly increase with viremia. Am. J. Transplant. 5(Suppl. 11):273A.
-
- Chang, D., M. Wang, W. C. Ou, M. S. Lee, H. N. Ho, and R. T. Tsai. 1996. Genotypes of human polyomaviruses in urine samples of pregnant women in Taiwan. J. Med. Virol. 48:95-101. - PubMed
Publication types
MeSH terms
Substances
Grants and funding
LinkOut - more resources
Full Text Sources
Other Literature Sources
Medical
Miscellaneous