Clinical Trial
. 2007 May;56(5):641-8.
doi: 10.1007/s00262-006-0225-8. Epub 2006 Sep 8.

Metronomic cyclophosphamide regimen selectively depletes CD4+CD25+ regulatory T cells and restores T and NK effector functions in end stage cancer patients

Affiliations
Clinical Trial

Metronomic cyclophosphamide regimen selectively depletes CD4+CD25+ regulatory T cells and restores T and NK effector functions in end stage cancer patients

François Ghiringhelli et al. Cancer Immunol Immunother. 2007 May.

Abstract

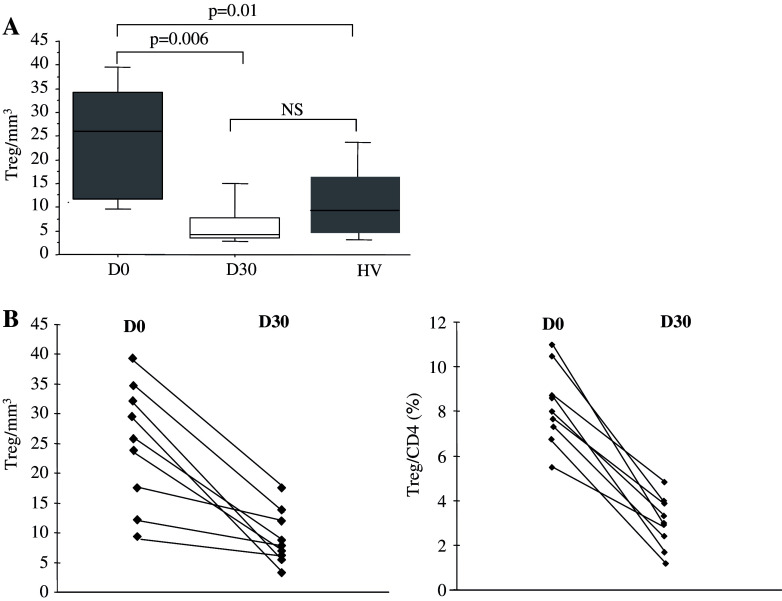
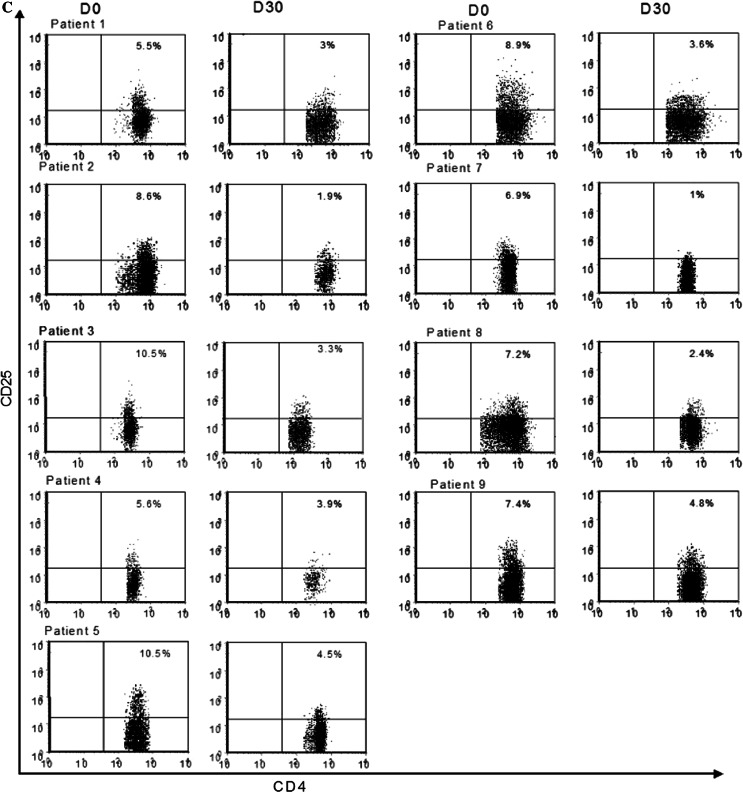
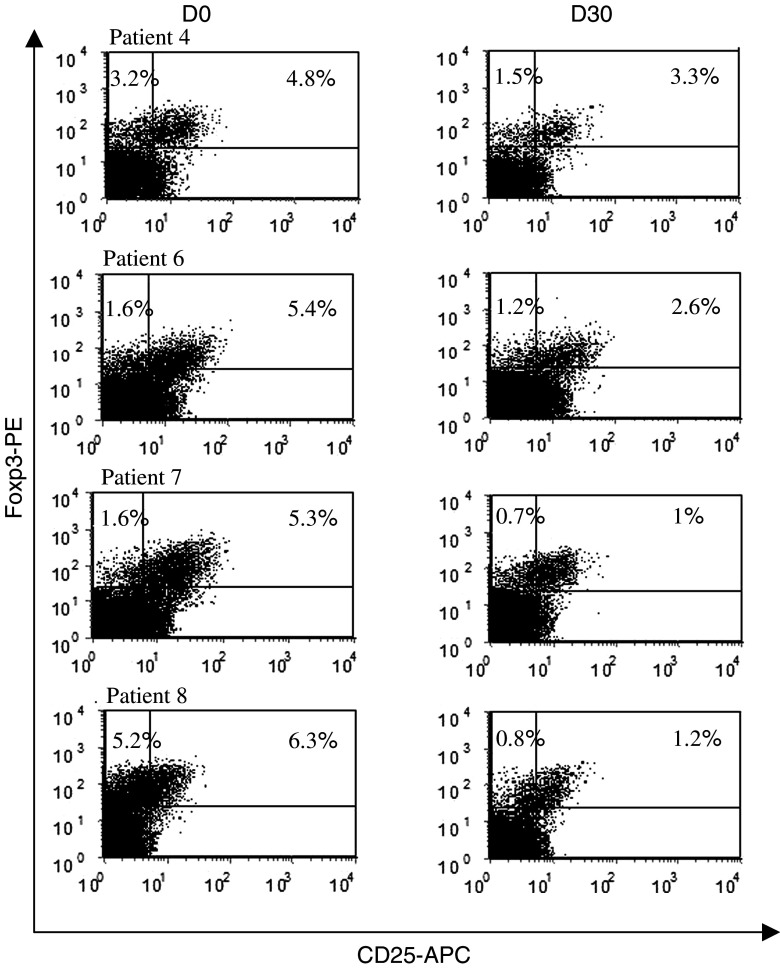
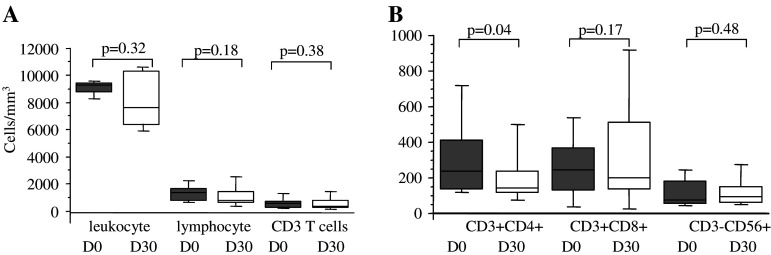
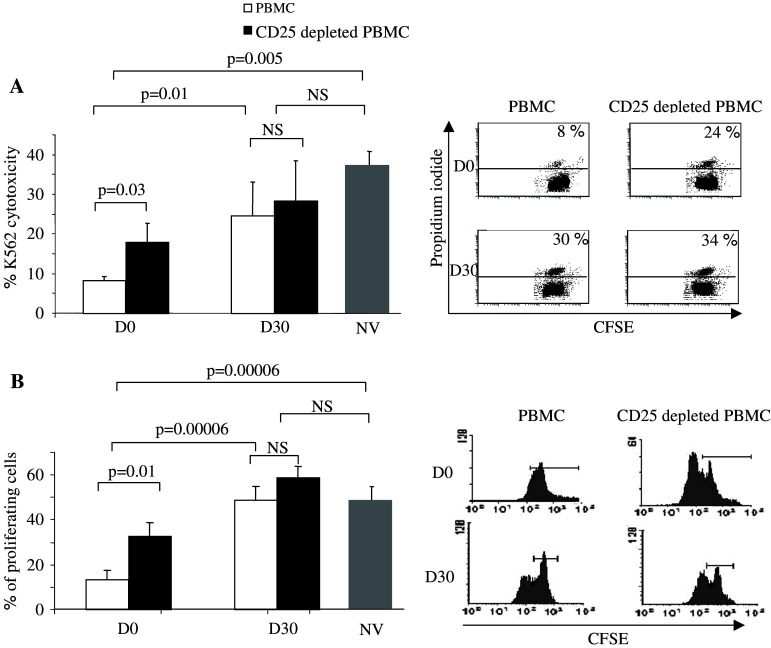
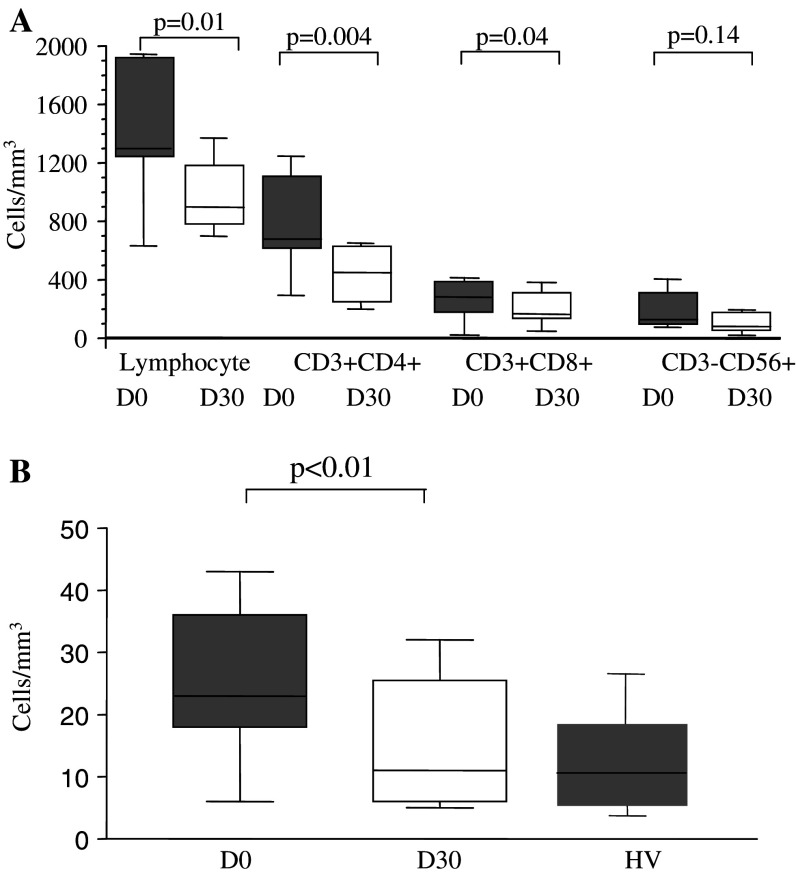
CD4+CD25+ regulatory T cells are involved in the prevention of autoimmune diseases and in tumor-induced tolerance. We previously demonstrated in tumor-bearing rodents that one injection of cyclophosphamide could significantly decrease both numbers and suppressive functions of regulatory T cells, facilitating vaccine-induced tumor rejection. In humans, iterative low dosing of cyclophosphamide, referred to as "metronomic" therapy, has recently been used in patients with advanced chemotherapy resistant cancers with the aim of reducing tumor angiogenesis. Here we show that oral administration of metronomic cyclophosphamide in advanced cancer patients induces a profound and selective reduction of circulating regulatory T cells, associated with a suppression of their inhibitory functions on conventional T cells and NK cells leading to a restoration of peripheral T cell proliferation and innate killing activities. Therefore, metronomic regimen of cyclophosphamide does not only affect tumor angiogenesis but also strongly curtails immunosuppressive regulatory T cells, favoring a better control of tumor progression. Altogether these data support cyclophosphamide regimen as a valuable treatment for reducing tumor-induced immune tolerance before setting to work anticancer immunotherapy.


Figures

Fig. 1
Fig. 1
Metronomic CTX selectively depletes regulatory T cells (Treg) in cancer patients. a Circulating numbers of CD3+CD4+CD25high per mm3 are determined by FACS analysis. The medians, 75 percentile (box) and SD (whiskers) are depicted for patients (n = 9, Table 1) before (D0) and 1 month after (D30) initiation of metronomic CTX and for healthy volunteers (HV) (n = 15). b Representation of Treg evolution as absolute number (left panel) and percentage of CD4+ T cells (right panel) during metronomic CTX regimen before (D0) and 1 month after (D30) initiation of metronomic CTX for each of the nine treated patients using FACS 3-color staining gating on CD3+CD4+CD25high cells. c Multipanel representation of dot-blot analysis of CD4+CD25high T cells in all patients during metronomic CTX regimen before (D0) and 1 month after (D30) initiation of metronomic CTX for each patients using FACS 3-color staining gating on CD3+CD4+CD25high cells
Fig. 1
Fig. 1
Metronomic CTX selectively depletes regulatory T cells (Treg) in cancer patients. a Circulating numbers of CD3+CD4+CD25high per mm3 are determined by FACS analysis. The medians, 75 percentile (box) and SD (whiskers) are depicted for patients (n = 9, Table 1) before (D0) and 1 month after (D30) initiation of metronomic CTX and for healthy volunteers (HV) (n = 15). b Representation of Treg evolution as absolute number (left panel) and percentage of CD4+ T cells (right panel) during metronomic CTX regimen before (D0) and 1 month after (D30) initiation of metronomic CTX for each of the nine treated patients using FACS 3-color staining gating on CD3+CD4+CD25high cells. c Multipanel representation of dot-blot analysis of CD4+CD25high T cells in all patients during metronomic CTX regimen before (D0) and 1 month after (D30) initiation of metronomic CTX for each patients using FACS 3-color staining gating on CD3+CD4+CD25high cells
Fig. 2
Fig. 2
Decrease in the number of Foxp3+ cells during the treatment. Three-color staining gating on CD4+ cells and analysis of CD25 and Foxp3 expression in four patients before and 1 month after initiation of the CTX metronomic treatment
Fig. 3
Fig. 3
Evolution of leukocyte subpopulations during metronomic CTX treatment. a Leukocyte, lymphocyte and CD3+ T lymphocyte counts in the blood of patients (n = 9, Table 1) before and 1 month after initiating metronomic CTX. b Counts of T and NK cell subsets in blood. Flow cytometry analyses allowed to assess the percentages of CD3+CD4+ and CD3+CD8+ lymphocytes and CD3-CD56+ NK cells. Absolute numbers were calculated from whole blood cell enumeration in the nine patients before and 1 month after initiation of metronomic CTX. Statistical analyses used the Fisher’s exact method
Fig. 4
Fig. 4
T and NK cell functions are enhanced following metronomic CTX treatment in cancer patients. a Killing of K562. Left panel 1 × 105 PBMC depleted or not from CD25+ cells were mixed with 1 × 104 CFSE-labeled K562 cells for 24 h. K562 cell death was assessed by flow cytometry as the percentage of CFSE labeled cells that incorporated propidium iodide. Graphs depict means ± standard deviation of percentages of dead cells for n = 6 patients (Table 1) before (D0) and after (D30) therapy and for n = 5 healthy volunteers. The right panels show detailed dot-plot analyses for a representative patient at D0 and D30 before or after depletion of CD25+ cells. b Proliferation of T cells induced by TCR signaling. Left panel 1 × 105 CFSE-labeled PBMC depleted or not from CD25+ cells were mixed for 72 h with beads coated with anti-CD3 and anti-CD28 mAbs. Proliferation of T cells was determined by flow cytometry as the percentage of CD3+ cells that diluted the CFSE dye. The graph depicts the mean ± standard deviation of percentages for n = 6 patients at D0 and D30 and for n = 5 healthy volunteers. The right panels show detailed CFSE labeling analyses for a representative patient at D0 and D30 before or after depletion of CD25+ cells. Statistical analyses used the Fisher’s exact method (a, b)
Fig. 5
Fig. 5
High dosage CTX (200 mg/day) metronomic treatment looses its specificity in Treg cell depletion. a Lymphocyte, CD3+CD4+ and CD3+CD8+ lymphocytes, and CD3-CD56+ NK cells absolute numbers were determined before and 1 month after initiating high dosage CTX metronomic treatment. b Effect on the CD3+CD4+CD25high Treg. Statistical analyses used the Fisher’s exact method

Similar articles

Cited by

References

    1. Baecher-Allan C, Wolf E, Hafler DA. Functional analysis of highly defined, FACS-isolated populations of human regulatory CD4+CD25+ T cells. Clin Immunol. 2005;115:S10–S18. doi: 10.1016/j.clim.2005.02.018. - DOI - PubMed
    1. Sakaguchi S. Regulatory T cells: key controllers of immunologic self-tolerance. Cell. 2000;101:455–458. doi: 10.1016/S0092-8674(00)80856-9. - DOI - PubMed
    1. Steitz J, Bruck J, Lenz J, Knop J, Tuting T. Depletion of CD25(+) CD4(+) T cells and treatment with tyrosinase-related protein 2-transduced dendritic cells enhance the interferon alpha-induced, CD8(+) T-cell-dependent immune defense of B16 melanoma. Cancer Res. 2001;61:8643–8646. - PubMed
    1. Ghiringhelli F, Larmonier N, Schmitt E, Parcellier A, Cathelin D, Garrido C, Chauffert B, Solary E, Bonnotte B, Martin F. CD4+CD25+ regulatory T cells suppress tumor immunity but are sensitive to cyclophosphamide which allows immunotherapy of established tumors to be curative. Eur J Immunol. 2004;34:336–344. doi: 10.1002/eji.200324181. - DOI - PubMed
    1. Ghiringhelli F, Puig PE, Roux S, Parcellier A, Schmitt E, Solary E, Kroemer G, Martin F, Chauffert B, Zitvogel L. Tumor cells convert immature myeloid dendritic cells into TGF-β-secreting cells inducing CD4+CD25+ regulatory T cell proliferation. J Exp Med. 2005;202:919–929. doi: 10.1084/jem.20050463. - DOI - PMC - PubMed

Publication types

Substances