

Analysis of pattern precision shows that Drosophila segmentation develops substantial independence from gradients of maternal gene products
- PMID: 16960857
- PMCID: PMC2254309
- DOI: 10.1002/dvdy.20940
Analysis of pattern precision shows that Drosophila segmentation develops substantial independence from gradients of maternal gene products
Abstract
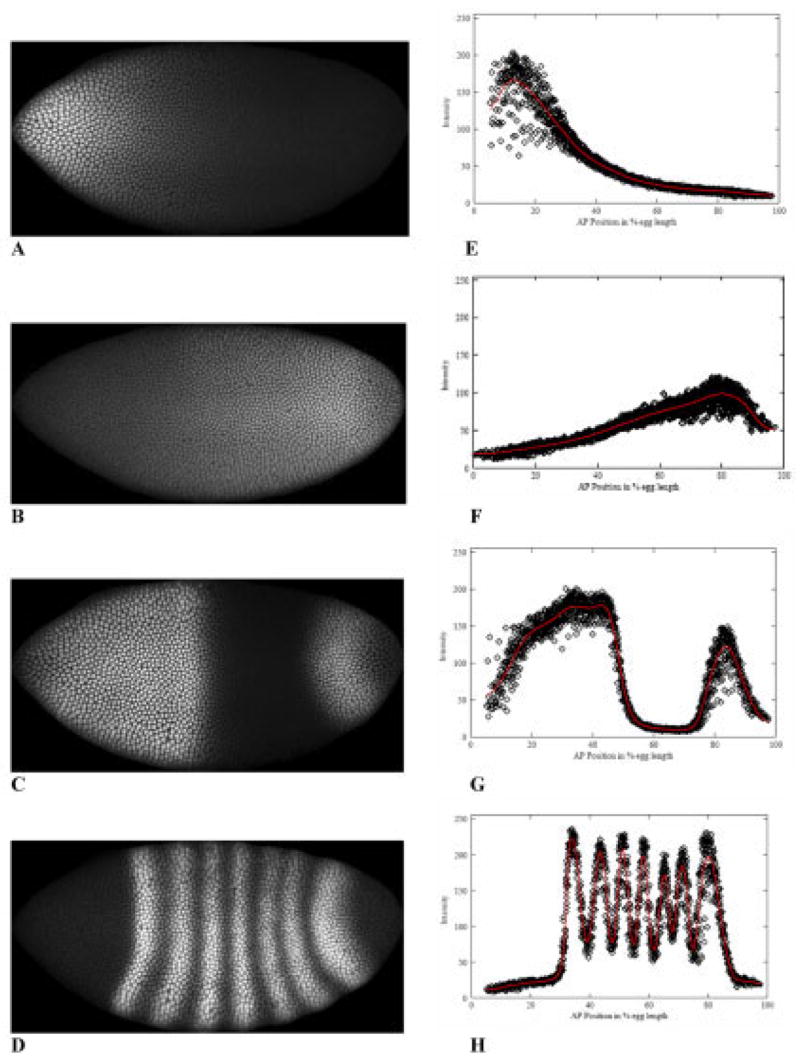
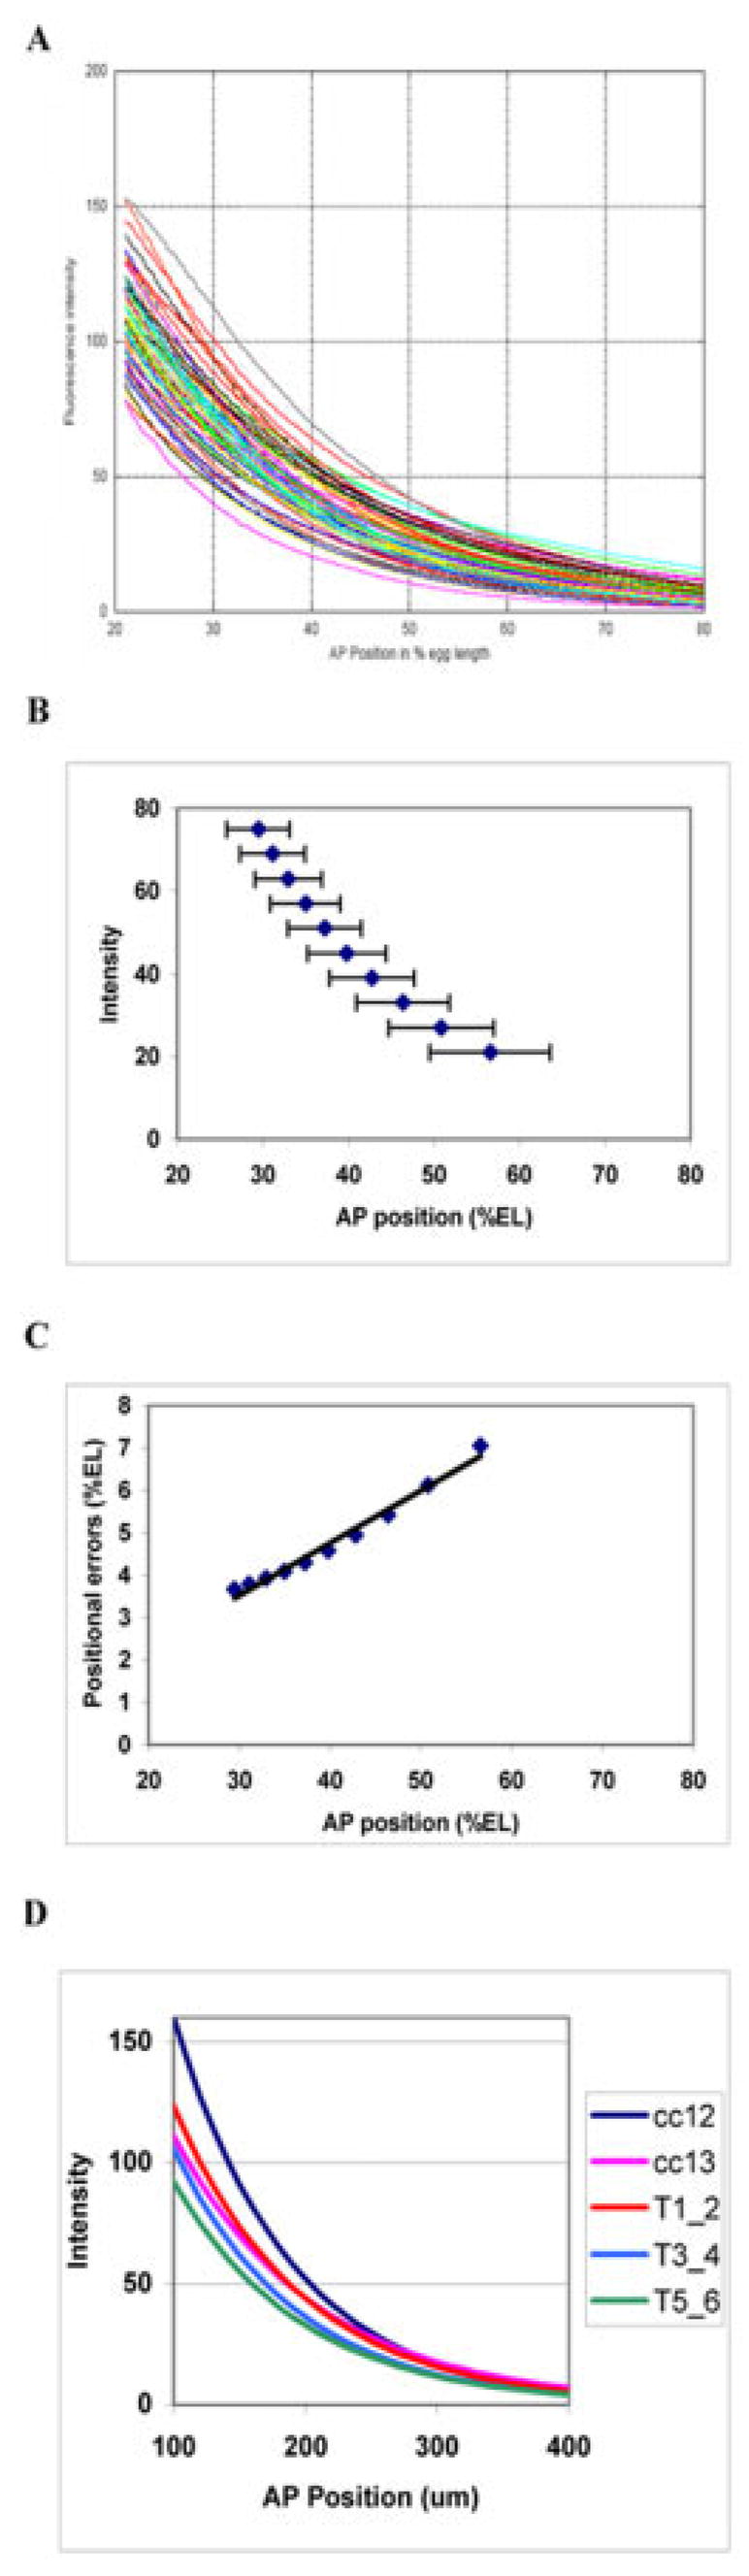
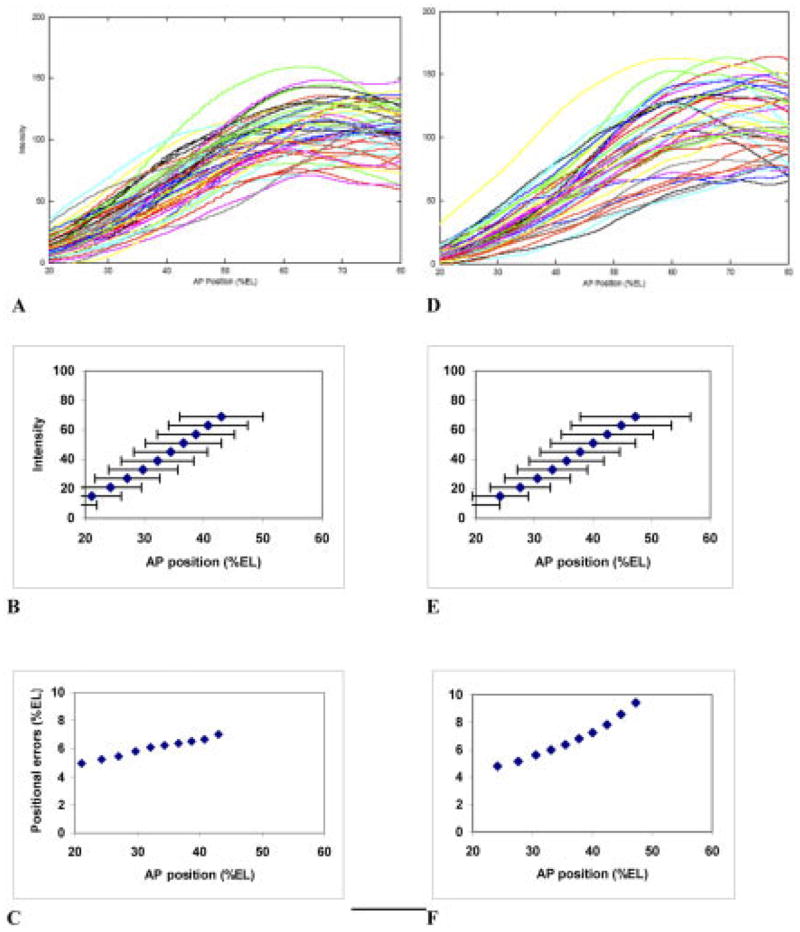
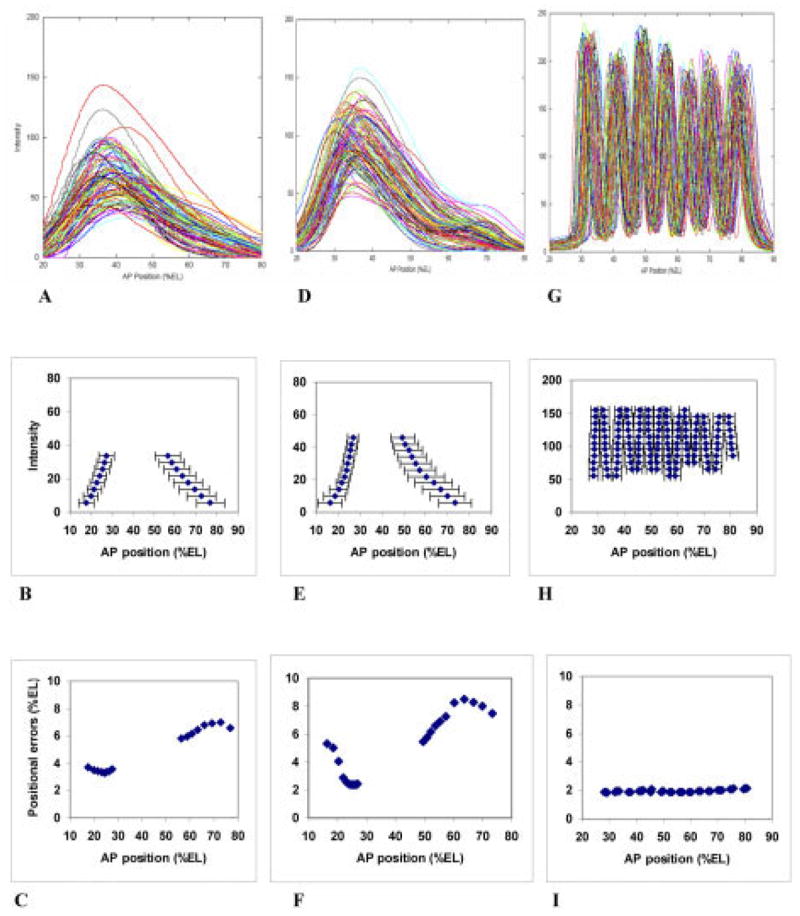
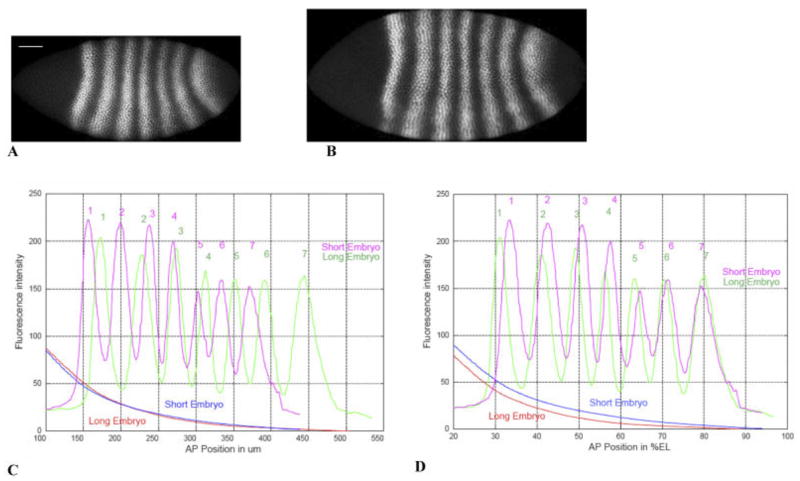
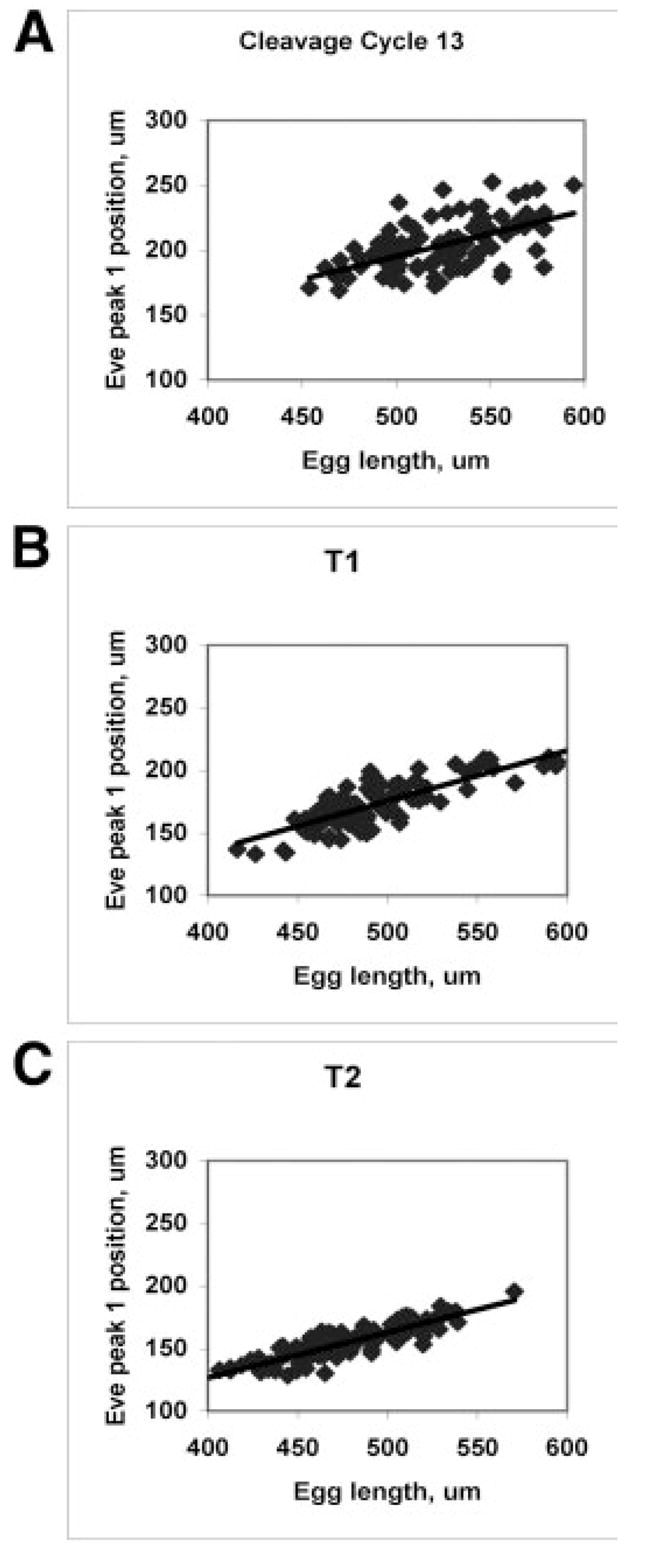
We analyze the relation between maternal gradients and segmentation in Drosophila, by quantifying spatial precision in protein patterns. Segmentation is first seen in the striped expression patterns of the pair-rule genes, such as even-skipped (eve). We compare positional precision between Eve and the maternal gradients of Bicoid (Bcd) and Caudal (Cad) proteins, showing that Eve position could be initially specified by the maternal protein concentrations but that these do not have the precision to specify the mature striped pattern of Eve. By using spatial trends, we avoid possible complications in measuring single boundary precision (e.g., gap gene patterns) and can follow how precision changes in time. During nuclear cleavage cycles 13 and 14, we find that Eve becomes increasingly correlated with egg length, whereas Bcd does not. This finding suggests that the change in precision is part of a separation of segmentation from an absolute spatial measure, established by the maternal gradients, to one precise in relative (percent egg length) units.
(c) 2006 Wiley-Liss, Inc.
Figures
Similar articles
-
Anterior repression of a Drosophila stripe enhancer requires three position-specific mechanisms.Development. 2002 Nov;129(21):4931-40. doi: 10.1242/dev.129.21.4931. Development. 2002. PMID: 12397102
-
Modeling the precision and robustness of Hunchback border during Drosophila embryonic development.J Theor Biol. 2008 Sep 21;254(2):390-9. doi: 10.1016/j.jtbi.2008.05.021. Epub 2008 May 24. J Theor Biol. 2008. PMID: 18621403
-
Natural variation of the expression pattern of the segmentation gene even-skipped in melanogaster.Dev Biol. 2015 Sep 1;405(1):173-81. doi: 10.1016/j.ydbio.2015.06.019. Epub 2015 Jun 27. Dev Biol. 2015. PMID: 26129990 Free PMC article.
-
From gradients to stripes in Drosophila embryogenesis: filling in the gaps.Trends Genet. 1996 Nov;12(11):478-83. doi: 10.1016/0168-9525(96)10044-5. Trends Genet. 1996. PMID: 8973159 Review.
-
A matter of time: Formation and interpretation of the Bicoid morphogen gradient.Curr Top Dev Biol. 2020;137:79-117. doi: 10.1016/bs.ctdb.2019.11.016. Epub 2019 Dec 27. Curr Top Dev Biol. 2020. PMID: 32143754 Review.
Cited by
-
A matter of timing and precision.Mol Syst Biol. 2010 Nov 16;6:427; author reply 428. doi: 10.1038/msb.2010.85. Mol Syst Biol. 2010. PMID: 21081921 Free PMC article. No abstract available.
-
Rapid response of fly populations to gene dosage across development and generations.Nat Commun. 2024 May 29;15(1):4551. doi: 10.1038/s41467-024-48960-4. Nat Commun. 2024. PMID: 38811562 Free PMC article.
-
Formation of the bicoid morphogen gradient: an mRNA gradient dictates the protein gradient.Development. 2009 Feb;136(4):605-14. doi: 10.1242/dev.031195. Development. 2009. PMID: 19168676 Free PMC article.
-
Causality analysis detects the regulatory role of maternal effect genes in the early Drosophila embryo.Genom Data. 2016 Nov 22;11:20-38. doi: 10.1016/j.gdata.2016.11.013. eCollection 2017 Mar. Genom Data. 2016. PMID: 27924281 Free PMC article.
-
Pipeline for acquisition of quantitative data on segmentation gene expression from confocal images.Fly (Austin). 2008 Mar-Apr;2(2):58-66. doi: 10.4161/fly.6060. Epub 2008 Mar 8. Fly (Austin). 2008. PMID: 18820476 Free PMC article. Review.
References
-
- Aegerter-Wilmsen T, Aegerter CM, Bisseling T. Model for robust establishment of precise proportions in the early Drosophila embryo. J Theor Biol. 2005;234:13–19. - PubMed
-
- Arnosti DN, Barolo S, Levine M, Small S. The eve stripe 2 enhancer employs multiple modes of transcriptional synergy. Development. 1996;122:205–214. - PubMed
-
- Barkai N, Leibler S. Robustness in simple biochemical networks. Nature. 1997;387:913–917. - PubMed
-
- Bateson W. Materials for the study of variation with especial regard to discontinuity in the origin of species. London: McMillan; 1894.
-
- Becksei A, Serrano L. Engineering stability in gene networks by autoregulation. Nature. 2000;405:590–593. - PubMed
Publication types
MeSH terms
Substances
Grants and funding
LinkOut - more resources
Full Text Sources
Molecular Biology Databases
Miscellaneous
