

Color constancy in natural scenes explained by global image statistics
- PMID: 16961965
- PMCID: PMC1896061
- DOI: 10.1017/S0952523806233455
Color constancy in natural scenes explained by global image statistics
Abstract
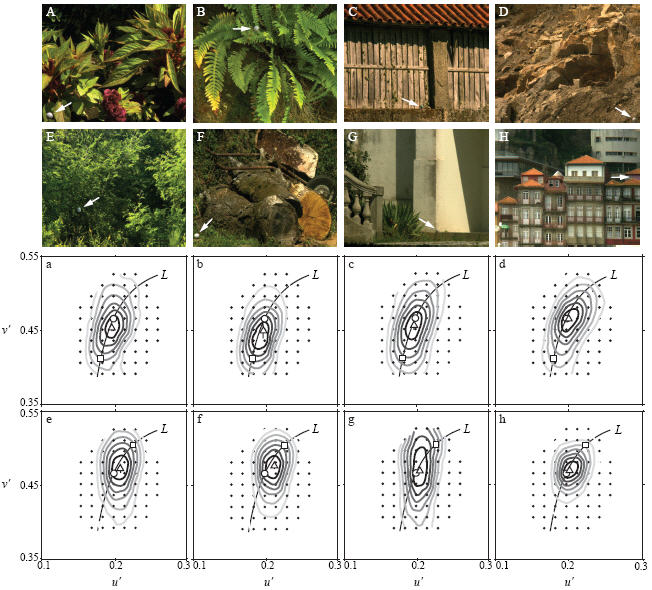
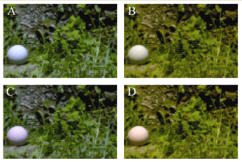
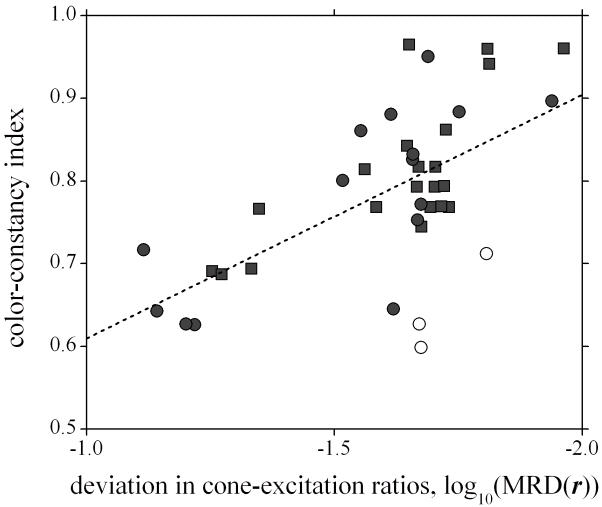
To what extent do observers' judgments of surface color with natural scenes depend on global image statistics? To address this question, a psychophysical experiment was performed in which images of natural scenes under two successive daylights were presented on a computer-controlled high-resolution color monitor. Observers reported whether there was a change in reflectance of a test surface in the scene. The scenes were obtained with a hyperspectral imaging system and included variously trees, shrubs, grasses, ferns, flowers, rocks, and buildings. Discrimination performance, quantified on a scale of 0 to 1 with a color-constancy index, varied from 0.69 to 0.97 over 21 scenes and two illuminant changes, from a correlated color temperature of 25,000 K to 6700 K and from 4000 K to 6700 K. The best account of these effects was provided by receptor-based rather than colorimetric properties of the images. Thus, in a linear regression, 43% of the variance in constancy index was explained by the log of the mean relative deviation in spatial cone-excitation ratios evaluated globally across the two images of a scene. A further 20% was explained by including the mean chroma of the first image and its difference from that of the second image and a further 7% by the mean difference in hue. Together, all four global color properties accounted for 70% of the variance and provided a good fit to the effects of scene and of illuminant change on color constancy, and, additionally, of changing test-surface position. By contrast, a spatial-frequency analysis of the images showed that the gradient of the luminance amplitude spectrum accounted for only 5% of the variance.
Figures
Similar articles
-
Anomalous trichromats' judgments of surface color in natural scenes under different daylights.Vis Neurosci. 2006 May-Aug;23(3-4):629-35. doi: 10.1017/S0952523806233297. Vis Neurosci. 2006. PMID: 16962006 Free PMC article.
-
Color constancy in natural scenes with and without an explicit illuminant cue.Vis Neurosci. 2006 May-Aug;23(3-4):351-6. doi: 10.1017/S0952523806233285. Vis Neurosci. 2006. PMID: 16961966
-
Minimum-variance cone-excitation ratios and the limits of relational color constancy.Vis Neurosci. 2004 May-Jun;21(3):337-40. doi: 10.1017/s095252380421327x. Vis Neurosci. 2004. PMID: 15518210
-
Color constancy.Vision Res. 2011 Apr 13;51(7):674-700. doi: 10.1016/j.visres.2010.09.006. Epub 2010 Sep 16. Vision Res. 2011. PMID: 20849875 Review.
-
Color contrast: a contributory mechanism to color constancy.Prog Brain Res. 2004;144:147-60. doi: 10.1016/s0079-6123(03)14410-x. Prog Brain Res. 2004. PMID: 14650846 Review.
Cited by
-
Color constancy: phenomenal or projective?Percept Psychophys. 2008 Feb;70(2):219-28. doi: 10.3758/pp.70.2.219. Percept Psychophys. 2008. PMID: 18372745 Free PMC article.
-
The effect of illumination cues on color constancy in simultaneous identification of illumination and reflectance changes.J Vis. 2025 May 1;25(6):4. doi: 10.1167/jov.25.6.4. J Vis. 2025. PMID: 40327002 Free PMC article.
-
Colour constancy failures expected in colourful environments.Proc Biol Sci. 2022 Jan 26;289(1967):20212483. doi: 10.1098/rspb.2021.2483. Epub 2022 Jan 26. Proc Biol Sci. 2022. PMID: 35078360 Free PMC article.
-
Anomalous trichromats' judgments of surface color in natural scenes under different daylights.Vis Neurosci. 2006 May-Aug;23(3-4):629-35. doi: 10.1017/S0952523806233297. Vis Neurosci. 2006. PMID: 16962006 Free PMC article.
-
The effect of scene articulation on transparent layer constancy.J Vis. 2021 Sep 1;21(10):16. doi: 10.1167/jov.21.10.16. J Vis. 2021. PMID: 34550309 Free PMC article.
References
-
- Arend LE, Jr, Reeves A, Schirillo J, Goldstein R. Simultaneous color constancy: papers with diverse Munsell values. Journal of the Optical Society of America A-Optics Image Science and Vision. 1991;8:661–672. - PubMed
-
- Bramwell DI, Hurlbert AC. Measurements of colour constancy by using a forced-choice matching technique. Perception. 1996;25:229–241. - PubMed
-
- Brenner E, Cornelissen FW. When is a background equivalent? Sparse chromatic context revisited. Vision Research. 1998;38:1789–1793. - PubMed
Publication types
MeSH terms
Grants and funding
LinkOut - more resources
Full Text Sources
