. 2006 Oct 13;363(1):201-14.
doi: 10.1016/j.jmb.2006.08.025. Epub 2006 Aug 15.

Multisite promiscuity in the processing of endogenous substrates by human carboxylesterase 1

Affiliations

Multisite promiscuity in the processing of endogenous substrates by human carboxylesterase 1

Sompop Bencharit et al. J Mol Biol. .

Abstract

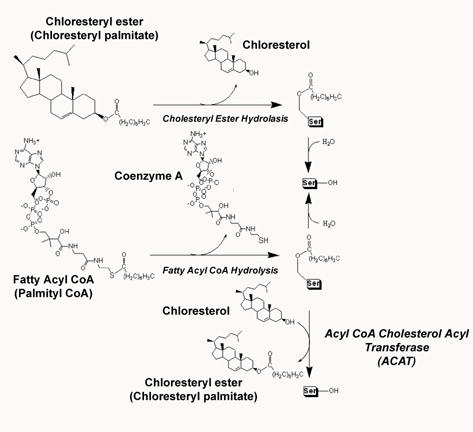
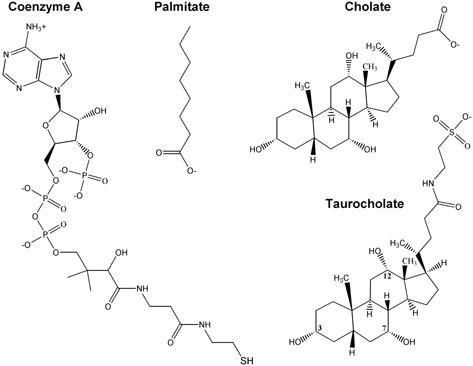
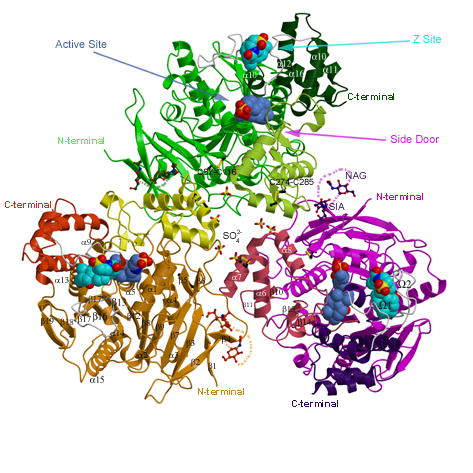
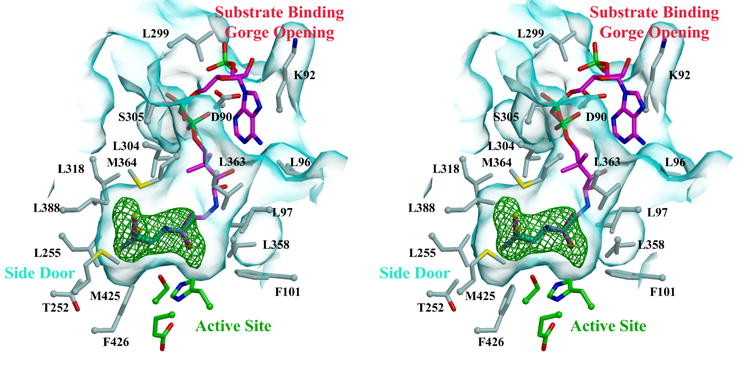
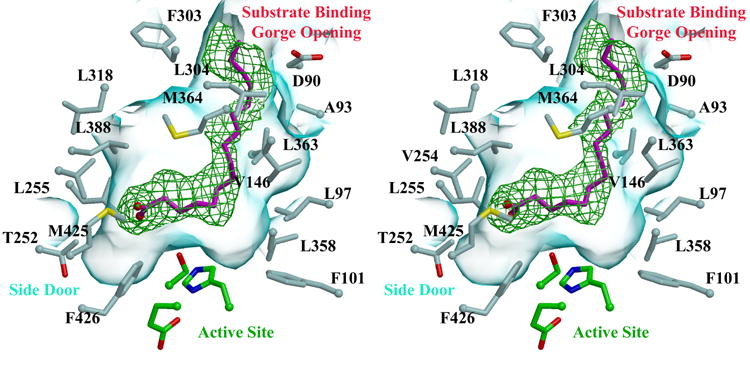
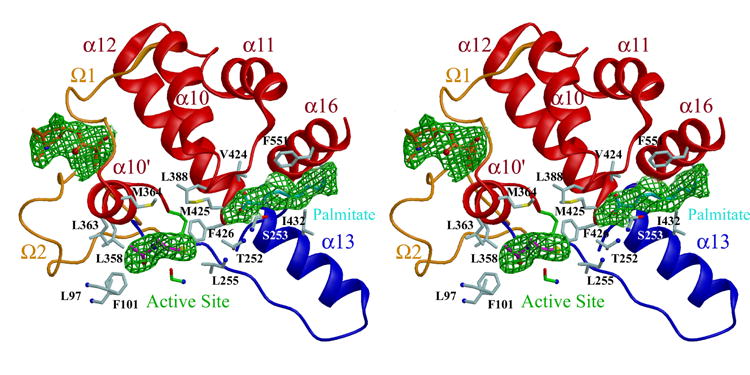
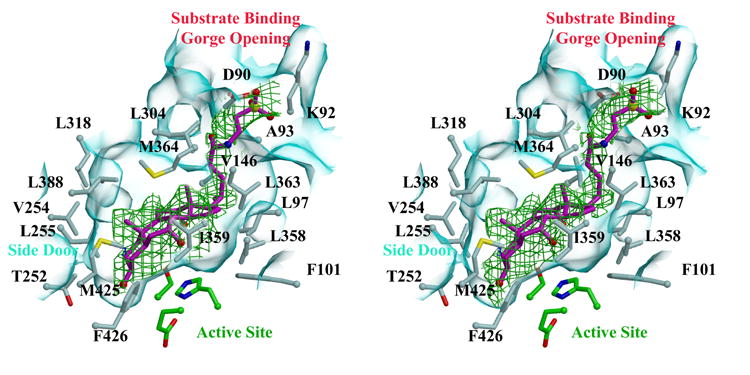
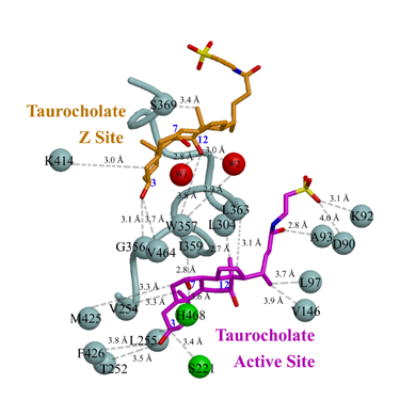
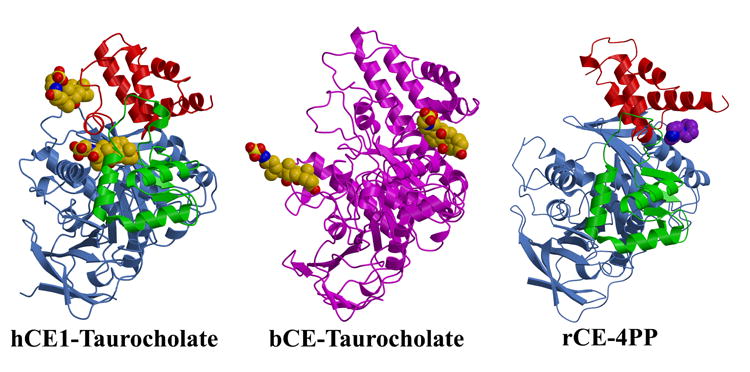
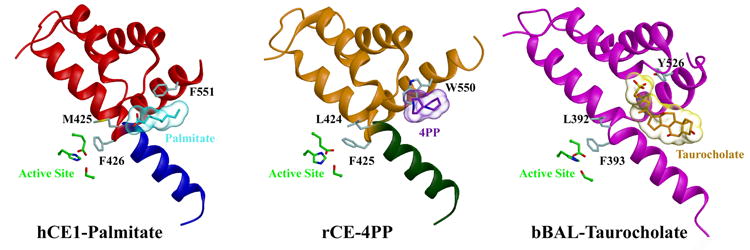
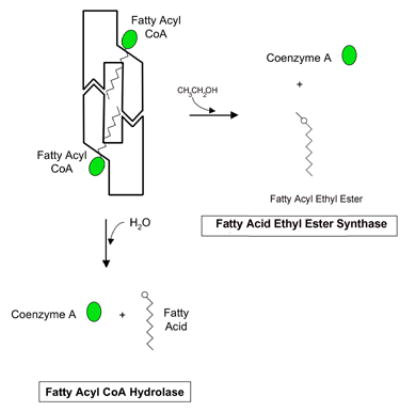
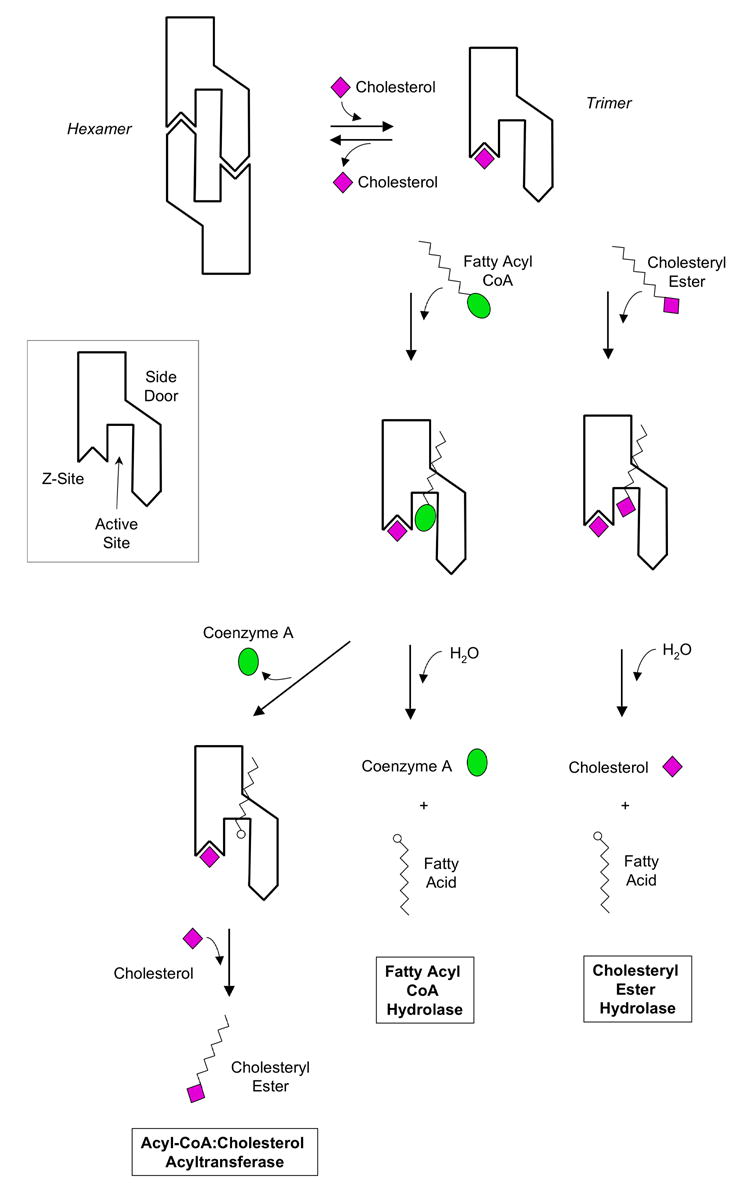
Human carboxylesterase 1 (hCE1) is a drug and endobiotic-processing serine hydrolase that exhibits relatively broad substrate specificity. It has been implicated in a variety of endogenous cholesterol metabolism pathways including the following apparently disparate reactions: cholesterol ester hydrolysis (CEH), fatty acyl Coenzyme A hydrolysis (FACoAH), acyl-Coenzyme A:cholesterol acyltransfer (ACAT), and fatty acyl ethyl ester synthesis (FAEES). The structural basis for the ability of hCE1 to perform these catalytic actions involving large substrates and products has remained unclear. Here we present four crystal structures of the hCE1 glycoprotein in complexes with the following endogenous substrates or substrate analogues: Coenzyme A, the fatty acid palmitate, and the bile acids cholate and taurocholate. While the active site of hCE1 was known to be promiscuous and capable of interacting with a variety of chemically distinct ligands, these structures reveal that the enzyme contains two additional ligand-binding sites and that each site also exhibits relatively non-specific ligand-binding properties. Using this multisite promiscuity, hCE1 appears structurally capable of assembling several catalytic events depending, apparently, on the physiological state of the cellular environment. These results expand our understanding of enzyme promiscuity and indicate that, in the case of hCE1, multiple non-specific sites are employed to perform distinct catalytic actions.


Figures

Figure 1
Figure 1. Endogenous Substrate Processing by hCE1
A) Cholesteryl ester hydrolysis (CEH), fatty acyl CoA hydrolysis (FACoAH), and acyl CoA cholesterol acyl transferase (ACAT) reactions. B) Endogenous ligands present in the crystal structures described here.
Figure 1
Figure 1. Endogenous Substrate Processing by hCE1
A) Cholesteryl ester hydrolysis (CEH), fatty acyl CoA hydrolysis (FACoAH), and acyl CoA cholesterol acyl transferase (ACAT) reactions. B) Endogenous ligands present in the crystal structures described here.
Figure 2
Figure 2. Overall Structure and CoA Binding
A) The hCE1 trimer colored as follows: the catalytic domains are in green, magenta, and orange; the αβ domains are in light green, pink, and yellow; and the regulatory domains are in dark green, purple, and red. Taurocholate ligands are shown in cornflower blue in the active site and cyan in the Z-site (in between 1 and 2 loops shown in grey). The glycosylation modifications, disulfide linkages, and sulfate ions are also shown. B) Stereoview of Coenzyme A (CoA) within the active site of hCE1. Note that the thiol tail of CoA ligand is observed in three conformations. The surface of the substrate binding gorge is shown in cyan, while the surrounding residues are rendered in green for the active site and in grey for those lining the gorge. 2.0 Å resolution electron density contoured at 3σ from a simulated-annealing omit map calculated via |Fobs| − |Fcalc|, φcalc (with the ligand and a sphere 1.0 Å around the ligand omitted prior to annealing and map calculation) is shown in green.
Figure 3
Figure 3. Fatty Acyl CoA Processing
A) Stereoview of palmitate (magenta) within the substrate binding gorge of hCE1. Residues and surfaces are colored as shown in Figure 2B. 3.0 Å resolution electron density contoured at 2σ from a simulated-annealing omit map calculated via |Fobs| − |Fcalc|, φcalc (with the ligand and a sphere 1.0 Å around the ligand omitted prior to annealing and map calculation) is shown in green. B) Stereoview of palmitate (cyan) at the side door, the thiol tail of CoA (magenta) at the active site and homatropine (orange) at the Z-site. The catalytic and regulatory domains are in cornflower blue and red. Three ligands are found bound in this structure, The catalytic residues are shown in green, while some amino acid side chains within the active site and side door are shown in light blue. 2.8 Å resolution electron density contoured at 2σ from a simulated-annealing omit map calculated via |Fobs| − |Fcalc|, φcalc (with the ligands and a sphere 1.0 Å around the ligands omitted prior to annealing and map calculation) is shown in green.
Figure 4
Figure 4. Taurocholate Binding to hCE1
A) Stereoview of taurocholate (magenta) within the substrate binding gorge of hCE1. Residues and surfaces are colored as shown in Figure 2B. 3.2 Å resolution electron density contoured at 2σ from a simulated-annealing omit map calculated via |Fobs| − |Fcalc|, φcalc (with the ligand and a sphere 1.0 Å around the ligand omitted prior to annealing and map calculation) is shown in green. B) Relationship between taurocholate bound at the active site (magenta) and Z-site (orange) in hCE1. α10’ separates the two sites, with contact residues shown as grey balls, the catalytic residues as green balls, and water molecules in the Z-site as red balls.
Figure 5
Figure 5. Mechanistic Hypotheses for Endogenous Substrate Processing
A) The crystal structures of the hCE1-taurocholate complex, the bovine salt-activated lipase (bCE)-taurocholate complex, and the rabbit liver carboxylesterase (rCE)-4-piperidinopiperidine (4PP) complex are shown. The three domains of hCE1 and rCE (catalytic, αβ , and regulatory) are rendered in cornflower blue, green, and red, respectively, while the lipase is shown in magenta. Note that the taurocholate surface binding sites of hCE1 (the Z-site) and the lipase are distinct B) The active site and side door regions of hCE1, rCE and the bovine salt-activated lipase (bBAL). Note that the ligands, palmitate (in cyan) for hCE1, 4PP (in purple) for rCE, and taurocholate (in orange) for bBAL, are located at an equivalent side door region in each enzyme located in proximity to the active site. C) Schematic models of fatty acyl CoA hydrolysis and fatty acyl ethyl ester synthesis by the hCE1 hexamer. When the fatty acyl CoA is abundant, it is possible that the hexameric hCE1 would allow the acyl CoA substrate to enter the active site through the side door. See Figure 5D for a definition of the schematic regions of hCE1. D) Schematic models of cholesteryl ester hydrolysis, fatty acyl CoA hydrolysis, and acyl CoA cholesterol acyl transferase by the hCE1 trimer. First, excess cholesterol could bind the Z-site and shift the trimer-hexamer equilibrium towards trimer. Second, the substrates fatty acyl CoA or a cholesteryl ester could enter the active site through the main substrate binding gorge. For hydrolysis reactions, products (e.g., CoA, cholesterol and fatty acids) could leave through the main substrate binding gorge and the side door. For a transesterification, cholesterol may enter the active site via the substrate binding gorge, producing a cholesteryl ester.

References

    1. Williams FM. Clinical significance ofbesterases in man. Clin Pharmacokinet. 1985;10:392–403. - PubMed
    1. Satoh T, Hosokawa M. The mammalian carboxylesterases: from molecules to functions. Annu Rev Pharmacol Toxicol. 1998;38:257–288. - PubMed
    1. Redinbo MR, Bencharit S, Potter PM. Human carboxylesterase 1: from drug metabolism to drug discovery. Biochem Soc Trans. 2003;31:620–624. - PubMed
    1. Redinbo MR, Potter PM. Mammalian carboxylesterases: from drug targets to protein therapeutics. Drug Discov Today. 2005;10:313–325. - PubMed
    1. Kamendulis LM, Brzezinski MR, Pindel EV, Bosron WF, Dean RA. Metabolism of cocaine and heroin is catalyzed by the same human liver carboxylesterases. J Pharmacol Expt Ther. 1996;279:713–717. - PubMed

MeSH terms

Substances

LinkOut - more resources