. 2007 Apr;41(4):365-78.
doi: 10.1016/j.ceca.2006.07.010. Epub 2006 Sep 8.

Dynamic and static calcium gradients inside large snail (Helix aspersa) neurones detected with calcium-sensitive microelectrodes

Affiliations

Dynamic and static calcium gradients inside large snail (Helix aspersa) neurones detected with calcium-sensitive microelectrodes

Roger C Thomas et al. Cell Calcium. 2007 Apr.

Abstract

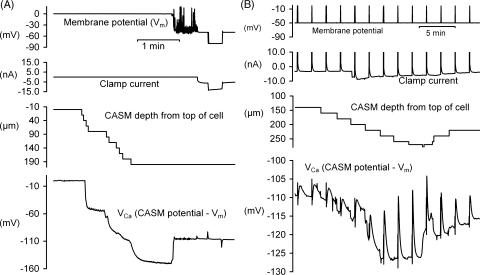
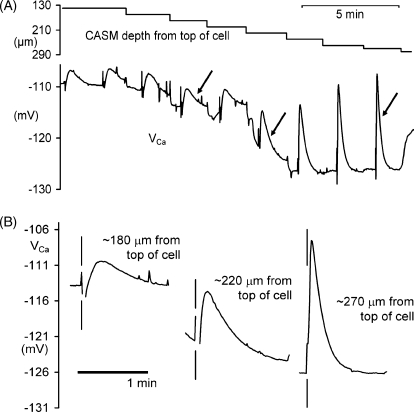
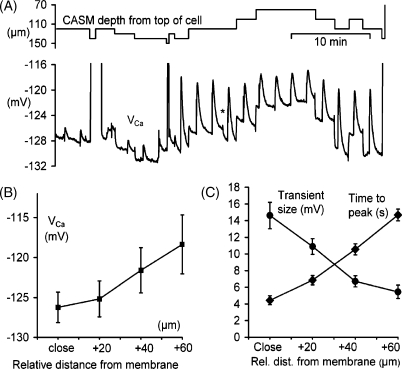
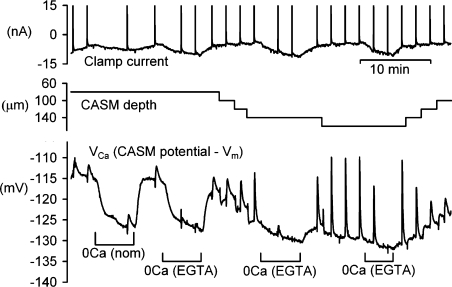
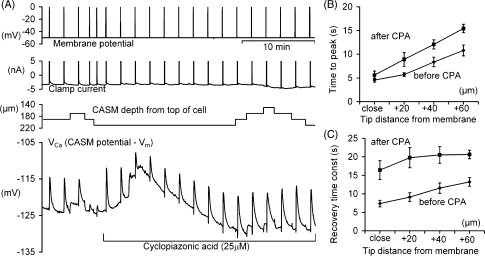
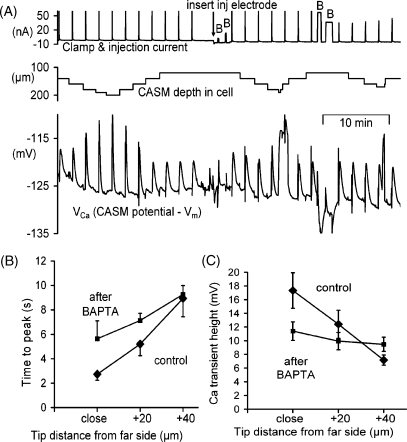
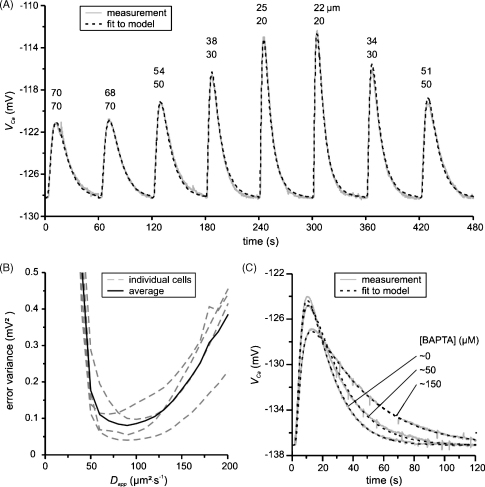
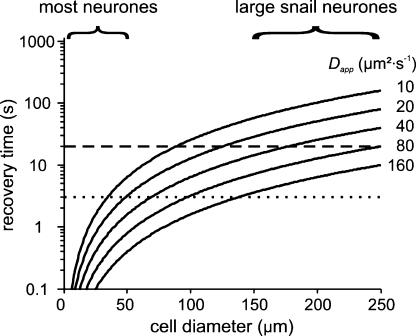
We have used quartz Ca2+-sensitive microelectrodes (CASMs) in large voltage-clamped snail neurones to investigate the inward spread of Ca2+ after a brief depolarisation. Both steady state and [Ca2+]i transients changed with depth of penetration. When the CASM tip was within 20 microm of the far side of the cell the [Ca2+]i transient time to peak was 4.4+/-0.5s, rising to 14.7+/-0.7s at a distance of 80 microm. We estimate that the Ca2+ transients travelled centripetally at an average speed of 6 microm2 s(-1) and decreased in size by half over a distance of about 45 microm. Cyclopiazonic acid had little effect on the size and time to peak of Ca2+ transients but slowed their recovery significantly. This suggests that the endoplasmic reticulum curtails rather than reinforces the transients. Injecting the calcium buffer BAPTA made the Ca2+ transients more uniform in size and increased their times to peak and rates of recovery near the membrane. We have developed a computational model for the transients, which includes diffusion, uptake and Ca2+ extrusion. Good fits were obtained with a rather large apparent diffusion coefficient of about 90+/-20 microm2 s(-1). This may assist fast recovery by extrusion.


Figures

Fig. 1
Fig. 1
Parts of a representative experiment to record intracellular calcium with a Ca2+-sensitive microelectrode (CASM). (A) Start of experiment, showing sequence of microelectrode insertions into a snail neurone. The potential from the CASM (VCa), which was referred to that from the membrane potential microelectrode, is shown on the bottom trace. The CASM was inserted first by making a series of 20 μm vertical downward movements starting with the electrode tip touching the top centre of the neuron. Once VCa had fallen below −130 mV (after reaching an apparent depth of 200 μm) a KCl-filled microelectrode was inserted to record the membrane potential (top trace), followed by a CsCl-filled microelectrode to pass clamp current (second trace, restricted to ±15 nA). The voltage-clamp was then activated and set to −50 mV. Finally a 30 mV hyperpolarisation for 20 s was applied to check that both the KCl microelectrode and CASM recorded the same change in potential. (B) Shows the same experiment 15 min later. Depolarisations (by 50 mV for 1 s) were applied every 2 min. After the first two depolarisations we moved the CASM deeper into the cell in steps of 10 or 20 μm to investigate how the responses changed. Once VCa started to increase rapidly we reversed the direction of movement. Parts of this figure are enlarged in Fig. 2.
Fig. 2
Fig. 2
CASM movements up to the far side of the cell. (A) Enlargement of parts of the records from Fig. 1, showing eight separate microelectrode movements down into a snail neurone. After the first two depolarsations we moved the CASM down in six steps of 20 μm and two steps of 10 μm, as shown in the upper trace, to investigate how the responses changed. Each depolarisation was by 50 mV from the holding potential of −50 mV, for 1 s every 2 min. (B) Enlargements of the three VCa transients arrowed in part (A). The vertical lines indicate the times at which the membrane was depolarised by 50 mV for 1 s.
Fig. 3
Fig. 3
(A) An experiment showing VCa transients in response to depolarisations by 50 mV recorded at different depths near the far side of a cell (Vm and clamp current records not shown). The first six depolarisations were for 100 ms, the rest were for 1 s. The large excursions in the VCa trace occurred when the CASM tip appeared to reach the far side. Halfway through the trace, shown by (*), there was a spontaneous 2 mV change. (B) Data from six similar experiments showing steady-state calcium levels (as VCa) plotted against the estimated distance of the CASM tip from the bottom of the cell. (C) Times to peak and sizes of VCa transients from six cells also plotted against distance from the bottom of the cell. VCa Data shown as means ± S.E.M.
Fig. 4
Fig. 4
Representative experiment showing the effect of removing external Ca2+ on the [Ca2+]i recorded by a CASM. The effects of nominally Ca-free solution applied when the CASM was 80 μm deep, and of Ca-free (EGTA) solution at three different depths were recorded.
Fig. 5
Fig. 5
The effect of CPA on the calcium transients at different depths. (A) Representative experimental record. All depolarisations were by 50 mV for 1 s except for the fourth and fifth which were for 100 ms. After 8 min the perfusate was changed to one containing 25 μm CPA. The clamp current record was restricted to the range ±5 nA. (B) The effect of CPA on the mean times from the start of the depolarisations to the peak of the VCa transients before and after CPA are plotted for five different cells and at four different distances from the cell membrane. (C) The average time constants for the recovery of the depolarisation-induced VCa transients before and after CPA are plotted for the same transients as in (B).
Fig. 6
Fig. 6
The effect of small and large BAPTA injections on Ca2+ transients at different depths. (A) Representative experiment. The cell was depolarised at 2 min intervals by 40 mV for 1 s. After 25 min a microelectrode filled with BAPTA was inserted at the point indicated by the arrow on the current record, and then BAPTA was injected four times where indicated by the letter B. The first two injections were estimated to load the cell to a concentration of 9 μm, the second two added an additional 125 μm. The clamp and injection current record was restricted to the range +60 to −10 nA. (B) The times to peak of Ca2+ transients recorded at three different distances from the cell membrane, before and after injecting BAPTA to a final concentration of 100–150 μm. (C) The VCa transient heights for the same three distances and BAPTA injections as in (A). Data from three cells.
Fig. 7
Fig. 7
Results from the computational modelling of calcium transients. (A) Fitted Ca2+ transients measured at various depths; the cell diameter was 240 μm. The lower numbers above the peaks indicate the estimated distances from the membrane (from the micromanipulator) and the upper numbers are obtained from the optimal fit. The remaining apparent parameters are: ICa,app = −4.6 nA, Dapp = 80 μm2 s−1, Pout,app = 11 μm s−1, kseq,app = 0.047 s−1 and τCASM = 2.1 s. (B) Error variance of the fit as a function of the apparent diffusion coefficient. In four different cells least square fits were obtained with varying fixed apparent diffusion coefficients, all other parameters were allowed to change. In each cell we fitted at least three transients measured at distances ∼40, ∼60 and ∼80 μm. The mean error variance curve has a minimum error at 90 ± 20 μm2 s−1. (C) Transients measured with different BAPTA concentrations were simultaneously fitted to the model. The distances obtained from the fit were 52 μm (0 μM BAPTA), 54 μm (50 μM BAPTA) and 60 μm (150 μM BAPTA), respectively. Dapp was calculated with Eq. (1) and all transport processes were scaled down with the total buffering power; the cell diameter was 240 μm. The parameters obtained from the fit were: De = 1000 μm2 s−1, κe = 65, Db = 1830 μm2 s−1, κb = 26 (50 μM BAPTA), κb = 102 (150 μM BAPTA). The apparent diffusion coefficients at different BAPTA concentrations are: Dapp = 102 μm2 s−1 (0 μM BAPTA), Dapp = 125 μm2 s−1 (50 μM BAPTA) and Dapp = 151 μm2 s−1 (150 μM BAPTA). The remaining real parameters (not scaled with κtot) are: ICa = −63 nA, Pout = 120.0 μm s−1, kseq = 2.9 s−1 and τCASM = 1.5 s.
Fig. 8
Fig. 8
Calculated recovery times after a Ca2+ calcium transient for various diffusion coefficients as function of the cell diameter. Modelled calcium recovery times for spherical neurones of diameters up to 250 μm, assuming that diffusion is the rate-limiting process. Most neurones are in the range of 0–50 μm and recover in a few seconds; slow diffusion is not critical in those cases. Large snail neurones recover in about 10–20 s, which requires faster diffusion.

Similar articles

Cited by

References

    1. Berridge M.J. Neuronal calcium signalling. Neuron. 1998;21:13–26. - PubMed
    1. Petersen O.H., Michalak M., Verkhratsky A. Calcium signalling: past, present and future. Cell Calcium. 2005;38:161–169. - PubMed
    1. Fields R.D., Lee P.R., Cohen J.E. Temporal integration of intracellular Ca2+ signaling networks in regulating gene expression by action potentials. Cell Calcium. 2005;37:433–442. - PubMed
    1. Marius P., Guerra M.T., Nathanson M.H., Ehrlich B.E., Leite M.F. Calcium release from ryanodine receptors in the nucleoplasmic reticulum. Cell Calcium. 2006;39:65–73. - PubMed
    1. Grynkiewicz G., Poenie M., Tsien R.Y. A new generation of Ca2+ indicators with greatly improved fluorescence properties. J. Biol. Chem. 1985;260:3440–3450. - PubMed

Publication types