

Structural transition of the inhibitory region of troponin I within the regulated cardiac thin filament
- PMID: 16962989
- PMCID: PMC1776856
- DOI: 10.1016/j.abb.2006.08.007
Structural transition of the inhibitory region of troponin I within the regulated cardiac thin filament
Abstract
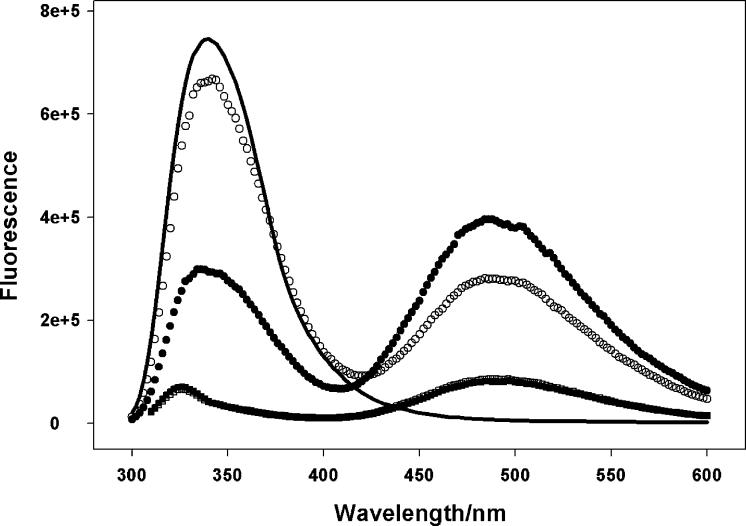
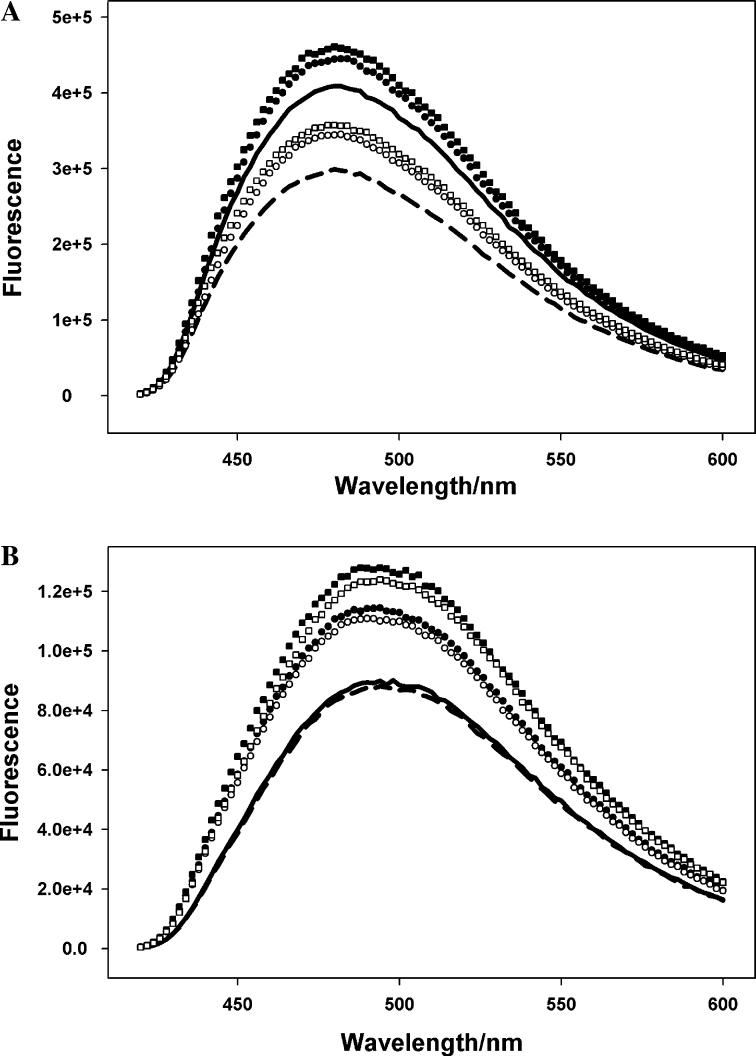
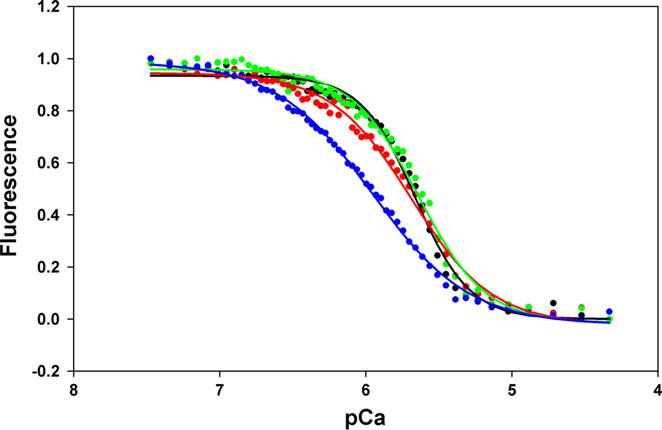
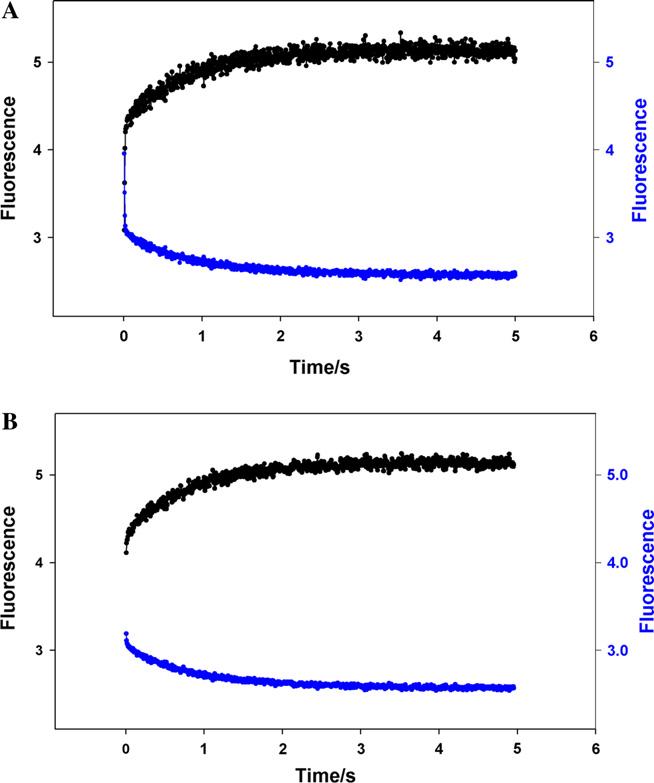
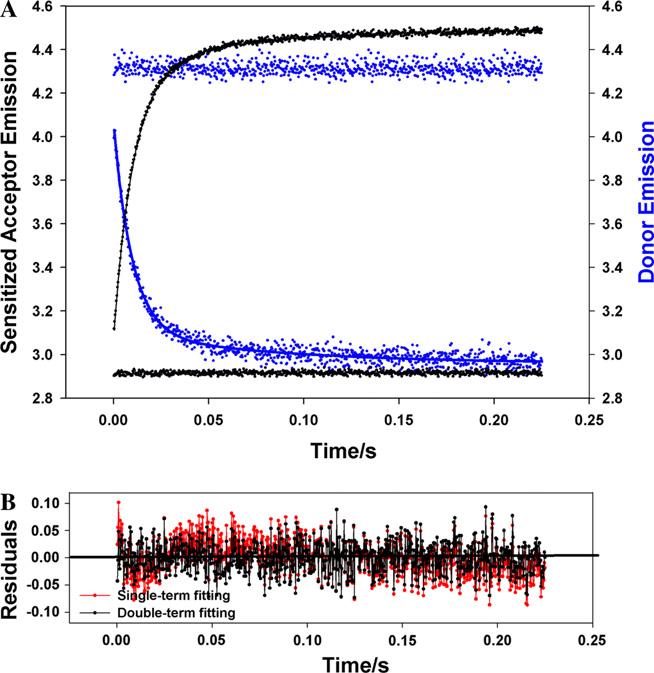
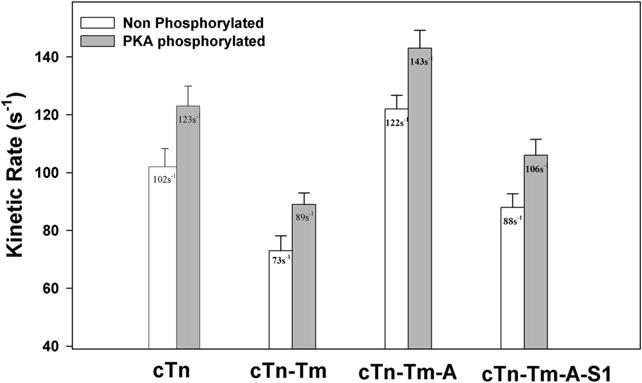
Contraction and relaxation of cardiac muscle are regulated by the inhibitory and regulatory regions of troponin I (cTnI). Our previous FRET studies showed that the inhibitory region of cTnI in isolated troponin experiences a structural transition from a beta-turn/coil motif to an extended conformation upon Ca(2+) activation. During the relaxation process, the kinetics of the reversal of this conformation is coupled to the closing of the Ca(2+)-induced open conformation of the N-domain of troponin C (cTnC) and an interaction between cTnC and cTnI in their interface. We have since extended the structural kinetic study of the inhibitory region to fully regulated thin filament. Single-tryptophan and single-cysteine mutant cTnI(L129W/S151C) was labeled with 1,5-IAEDANS at Cys151, and the tryptophan-AEDANS pair served as a donor-acceptor pair. Labeled cTnI mutant was used to prepare regulated thin filaments. Ca(2+)-induced conformational changes in the segment of Trp129-Cys151 of cTnI were monitored by FRET sensitized acceptor (AEDANS) emission in Ca(2+) titration and stopped-flow measurements. Control experiments suggested energy transfer from endogenous tryptophan residues of actin and myosin S1 to AEDANS attached to Cys151 of cTnI was very small and Ca(2+) independent. The present results show that the rate of Ca(2+)-induced structural transition and Ca(2+) sensitivity of the inhibitory region of cTnI were modified by (1) thin filament formation, (2) the presence of strongly bound S1, and (3) PKA phosphorylation of the N-terminus of cTnI. Ca(2+) sensitivity was not significantly changed by the presence of cTm and actin. However, the cTn-cTm interaction decreased the cooperativity and kinetics of the structural transition within cTnI, while actin filaments elicited opposite effects. The strongly bound S1 significantly increased the Ca(2+) sensitivity and slowed down the kinetics of structural transition. In contrast, PKA phosphorylation of cTnI decreased the Ca(2+) sensitivity and accelerated the structural transition rate of the inhibitory region of cTnI on thin filaments. These results support the idea of a feedback mechanism by strong cross-bridge interaction with actin and provide insights on the molecular basis for the fine tuning of cardiac function by beta-adrenergic stimulation.
Figures
Similar articles
-
Structural studies of interactions between cardiac troponin I and actin in regulated thin filament using Förster resonance energy transfer.Biochemistry. 2008 Dec 16;47(50):13383-93. doi: 10.1021/bi801492x. Biochemistry. 2008. PMID: 19053249 Free PMC article.
-
Effects of PKA phosphorylation of cardiac troponin I and strong crossbridge on conformational transitions of the N-domain of cardiac troponin C in regulated thin filaments.Biochemistry. 2007 Aug 28;46(34):9752-61. doi: 10.1021/bi700574n. Epub 2007 Aug 3. Biochemistry. 2007. PMID: 17676764 Free PMC article.
-
Förster resonance energy transfer structural kinetic studies of cardiac thin filament deactivation.J Biol Chem. 2009 Jun 12;284(24):16432-16441. doi: 10.1074/jbc.M808075200. Epub 2009 Apr 15. J Biol Chem. 2009. PMID: 19369252 Free PMC article.
-
Cardiac troponin structure-function and the influence of hypertrophic cardiomyopathy associated mutations on modulation of contractility.Arch Biochem Biophys. 2016 Jul 1;601:11-21. doi: 10.1016/j.abb.2016.02.004. Epub 2016 Feb 4. Arch Biochem Biophys. 2016. PMID: 26851561 Free PMC article. Review.
-
Biology of the troponin complex in cardiac myocytes.Prog Cardiovasc Dis. 2004 Nov-Dec;47(3):159-76. doi: 10.1016/j.pcad.2004.07.003. Prog Cardiovasc Dis. 2004. PMID: 15736582 Review.
Cited by
-
Structural dynamics of troponin I during Ca2+-activation of cardiac thin filaments: a multi-site Förster resonance energy transfer study.PLoS One. 2012;7(12):e50420. doi: 10.1371/journal.pone.0050420. Epub 2012 Dec 5. PLoS One. 2012. PMID: 23227172 Free PMC article.
-
pH-responsive titratable inotropic performance of histidine-modified cardiac troponin I.Biophys J. 2012 Apr 4;102(7):1570-9. doi: 10.1016/j.bpj.2012.01.024. Epub 2012 Apr 3. Biophys J. 2012. PMID: 22500757 Free PMC article.
-
Molecular determinants of cardiac myocyte performance as conferred by isoform-specific TnI residues.Biophys J. 2014 May 20;106(10):2105-14. doi: 10.1016/j.bpj.2014.04.017. Biophys J. 2014. PMID: 24853739 Free PMC article.
-
Ca(2+)-regulatory function of the inhibitory peptide region of cardiac troponin I is aided by the C-terminus of cardiac troponin T: Effects of familial hypertrophic cardiomyopathy mutations cTnI R145G and cTnT R278C, alone and in combination, on filament sliding.Arch Biochem Biophys. 2014 Jun 15;552-553:11-20. doi: 10.1016/j.abb.2013.12.021. Epub 2014 Jan 10. Arch Biochem Biophys. 2014. PMID: 24418317 Free PMC article.
-
The unique functions of cardiac troponin I in the control of cardiac muscle contraction and relaxation.Biochem Biophys Res Commun. 2008 Apr 25;369(1):82-7. doi: 10.1016/j.bbrc.2007.12.114. Epub 2007 Dec 26. Biochem Biophys Res Commun. 2008. PMID: 18162178 Free PMC article. Review.
References
-
- Ebashi S, Endo M. Prog. Biophys. Mol. Biol. 1968;18:123–183. - PubMed
-
- Farah CS, Reinach FC. FASEB J. 1995;9:755–767. - PubMed
-
- Liao R, Wang CK, Cheung HC. Biochemistry. 1994;33:12729–12734. - PubMed
-
- Gordon AM, Homsher E, Regnier M. Physiol. Rev. 2000;80:853–924. - PubMed
-
- van Eerd JP, Takahashi K. Biochem. Biophys. Res. Commun. 1975;64:122–127. - PubMed
Publication types
MeSH terms
Substances
Grants and funding
LinkOut - more resources
Full Text Sources
Research Materials
Miscellaneous
