. 2006 Sep 19;103(38):14116-21.
doi: 10.1073/pnas.0603090103. Epub 2006 Sep 8.

Alternative inclusion of fibroblast growth factor receptor 2 exon IIIc in Dunning prostate tumors reveals unexpected epithelial mesenchymal plasticity

Affiliations

Alternative inclusion of fibroblast growth factor receptor 2 exon IIIc in Dunning prostate tumors reveals unexpected epithelial mesenchymal plasticity

Sebastian Oltean et al. Proc Natl Acad Sci U S A. .

Abstract

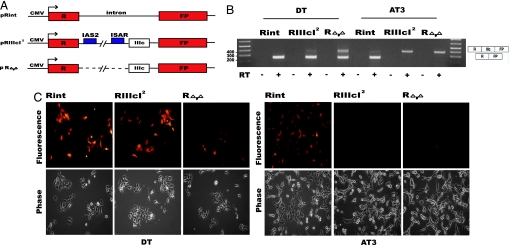
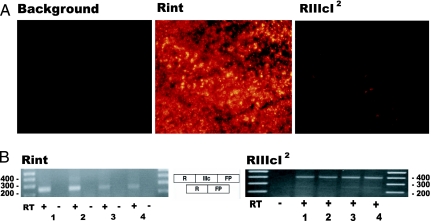
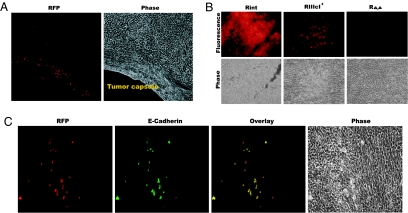
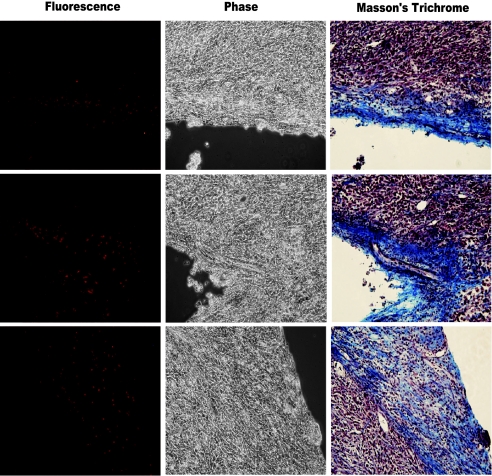
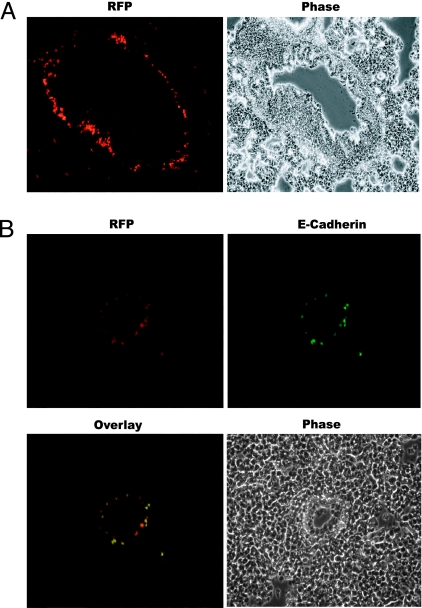
In epithelial cells, alternative splicing of fibroblast growth factor receptor 2 (FGFR2) transcripts leads to the expression of the FGFR2(IIIb) isoform, whereas in mesenchymal cells, the same process results in the synthesis of FGFR2(IIIc). Expression of the FGFR2(IIIc) isoform during prostate tumor progression suggests a disruption of the epithelial character of these tumors. To visualize the use of FGFR2 exon IIIc in prostate AT3 tumors in syngeneic rats, we constructed minigene constructs that report on alternative splicing. Imaging these alternative splicing decisions revealed unexpected mesenchymal-epithelial transitions in these primary tumors. These transitions were observed more frequently where tumor cells were in contact with stroma. Indeed, these transitions were frequently observed among lung micrometastases in the organ parenchyma and immediately adjacent to blood vessels. Our data suggest an unforeseen relationship between epithelial mesenchymal plasticity and malignant fitness.


Conflict of interest statement

Conflict of interest statement: M.A.G.-B. is a founder and consultant for Intronn, Inc., which owns and is commercializing the use of transsplicing reactions in gene therapy.

Figures

Fig. 1.
Fig. 1.
Minigene constructs, molecular analysis, and imaging of exon IIIc inclusion in DT3 and AT3 cells. (A) Schematic representation (not to scale) of the minigene reporters used to image alternative splicing. (B) RT-PCR analysis of the reporter in total RNA extracts from the different DT3 and AT3 cell lines was carried out as described in Methods. RT-PCRs for pRint, pRIIIcI2, or pRΔ,Δ transcripts resulted in the expected size products (398 bp for products that include IIIc and 250 bp for the products that skip this exon), and splice junctions were confirmed by sequencing. (C) Imaging FGFR2 exon IlIc inclusion in DT3 and AT3 cells. (Upper) Fluorescence imaging of DT3 and AT3 cells stably transfected with the pRint, pRIIIcI2, or pRΔ,Δ minigenes. (Lower) Phase-contrast pictures of the same fields (images were acquired at ×200 magnification).
Fig. 2.
Fig. 2.
Imaging alternative use of exon IlIc in AT3 tumors using fluorescent reporters. (A) Fluorescence imaging of AT3 tumor sections either untransfected (background) or stably transfected with the pRint and pRIIIcI2 constructs (all images were acquired at ×200 magnification). (B) RT-PCR analysis of the reporter was carried out as described in Methods. RT-PCRs for RFP transcripts resulted in the expected size products, and splice junctions were confirmed by sequencing. Analysis of four different regions (denoted 1, 2, 3, or 4) for each type of tumor is shown.
Fig. 3.
Fig. 3.
MET in tumors. (A) Fluorescence and phase-contrast images of a section of an AT3-RIIIcI2 tumor close to the tumor capsule. Images were acquired at ×200 magnification. (B) (Upper) Fluorescence images of sections of AT3-Rint, -RIIIcI2, and -RΔ,Δ tumors. (Lower) Phase-contrast pictures of the same fields. Images were acquired at ×400 magnification. (C) E-cadherin counterstaining confirms MET. Example of a section from AT3-RIIIcI2 tumors shows that the red fluorescent cells also stained positive for E-cadherin. Images were acquired at ×400 magnification.
Fig. 4.
Fig. 4.
MET predominates in stromal regions rich in collagen fibers. Masson’s Trichrome staining confirms that RFP+ cells are situated in stromal regions. Examples are shown from three regions of three different AT3-RIIIcI2 tumors (Left, image obtained with epifluorescence microscopy; Center, phase-contrast picture of the same field; Right, bright field of the same region located after Masson’s Trichrome staining. All images were acquired at ×200 magnification). In the Masson’s Trichrome images, collagen is stained in blue, nuclei in black, and cytoplasm of cells in red.
Fig. 5.
Fig. 5.
MET in lung metastasis. (A) Fluorescence and phase-contrast images of a lung section from animals harboring AT3-RIIIcI2 tumors (×200 magnification). Fluorescent cells are situated around a blood vessel (confirmed by hematoxylin/eosin staining; data not shown). (B) Example of a section from lungs of an animal bearing an AT3-RIIIcI2 tumor shows that the great majority of red fluorescent metastatic cells also stained positive for E-cadherin. Images were acquired at ×200 magnification.

Similar articles

Cited by

References

    1. Black DL. Annu Rev Biochem. 2003;72:291–336. - PubMed
    1. Faustino NA, Cooper TA. Genes Dev. 2003;17:419–437. - PubMed
    1. Schwerk C, Schulze-Osthoff K. Mol Cell. 2005;19:1–13. - PubMed
    1. Kalnina Z, Zayakin P, Silina K, Line A. Genes Chromosomes Cancer. 2005;42:342–357. - PubMed
    1. Venables JP. Cancer Res. 2004;64:7647–7654. - PubMed

Publication types

MeSH terms

Substances