Cytoskeletal polymer networks: the molecular structure of cross-linkers determines macroscopic properties
- PMID: 16963567
- PMCID: PMC1599898
- DOI: 10.1073/pnas.0510190103
Cytoskeletal polymer networks: the molecular structure of cross-linkers determines macroscopic properties
Abstract
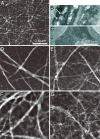
In living cells the mechanical properties of the actin cytoskeleton are defined by the local activation of different actin cross-linking proteins. These proteins consist of actin-binding domains that are separated and geometrically organized by different numbers of rod domains. The detailed molecular structure of the cross-linking molecules determines the structural and mechanical properties of actin networks in vivo. In this study, we systematically investigate the impact of the length of the spacing unit between two actin-binding domains on in vitro actin networks. Such synthetic cross-linkers reveal that the shorter the constructs are, the greater the elastic modulus changes in the linear response regime. Because the same binding domains are used in all constructs, only the differences in the number of rod domains determine their mechanical effectiveness. Structural rearrangements of the networks show that bundling propensity is highest for the shortest construct. The nonlinear mechanical response is affected by the molecular structure of the cross-linker molecules, and the observed critical strains and fracture stress increase proportional to the length of the spacing unit.
Conflict of interest statement
Conflict of interest statement: No conflicts declared.
Figures


Similar articles
-
Effective-medium approach for stiff polymer networks with flexible cross-links.Phys Rev E Stat Nonlin Soft Matter Phys. 2009 Jun;79(6 Pt 1):061914. doi: 10.1103/PhysRevE.79.061914. Epub 2009 Jun 11. Phys Rev E Stat Nonlin Soft Matter Phys. 2009. PMID: 19658531
-
Strain hardening, avalanches, and strain softening in dense cross-linked actin networks.Phys Rev E Stat Nonlin Soft Matter Phys. 2008 May;77(5 Pt 1):051913. doi: 10.1103/PhysRevE.77.051913. Epub 2008 May 16. Phys Rev E Stat Nonlin Soft Matter Phys. 2008. PMID: 18643108
-
Prokaryotic origin of the actin cytoskeleton.Nature. 2001 Sep 6;413(6851):39-44. doi: 10.1038/35092500. Nature. 2001. PMID: 11544518
-
Water and the cytoskeleton.Cell Mol Biol (Noisy-le-grand). 2001 Jul;47(5):901-23. Cell Mol Biol (Noisy-le-grand). 2001. PMID: 11728102 Review.
-
The bacterial cytoskeleton.Microbiol Mol Biol Rev. 2006 Sep;70(3):729-54. doi: 10.1128/MMBR.00017-06. Microbiol Mol Biol Rev. 2006. PMID: 16959967 Free PMC article. Review.
Cited by
-
Two fundamental mechanisms govern the stiffening of cross-linked networks.Biophys J. 2015 Mar 24;108(6):1470-1479. doi: 10.1016/j.bpj.2015.02.015. Biophys J. 2015. PMID: 25809259 Free PMC article.
-
Regulation of Cell Behavior by Hydrostatic Pressure.Appl Mech Rev. 2019 Jul;71(4):0408031-4080313. doi: 10.1115/1.4043947. Epub 2019 Jul 23. Appl Mech Rev. 2019. PMID: 31700195 Free PMC article. Review.
-
Quantitative tube model for semiflexible polymer solutions.Eur Phys J E Soft Matter. 2007 Sep;24(1):35-46. doi: 10.1140/epje/i2007-10208-2. Epub 2007 Sep 3. Eur Phys J E Soft Matter. 2007. PMID: 17767376
-
The microtubule cytoskeleton in cardiac mechanics and heart failure.Nat Rev Cardiol. 2022 Jun;19(6):364-378. doi: 10.1038/s41569-022-00692-y. Epub 2022 Apr 19. Nat Rev Cardiol. 2022. PMID: 35440741 Free PMC article. Review.
-
Measuring molecular rupture forces between single actin filaments and actin-binding proteins.Proc Natl Acad Sci U S A. 2008 Jul 8;105(27):9221-6. doi: 10.1073/pnas.0706124105. Epub 2008 Jun 30. Proc Natl Acad Sci U S A. 2008. PMID: 18591676 Free PMC article.
References
Publication types
MeSH terms
Substances
LinkOut - more resources
Full Text Sources

