. 2006 Sep;5(9):1468-89.
doi: 10.1128/EC.00107-06.

Metabolic-state-dependent remodeling of the transcriptome in response to anoxia and subsequent reoxygenation in Saccharomyces cerevisiae

Affiliations

Metabolic-state-dependent remodeling of the transcriptome in response to anoxia and subsequent reoxygenation in Saccharomyces cerevisiae

Liang-Chuan Lai et al. Eukaryot Cell. 2006 Sep.

Abstract

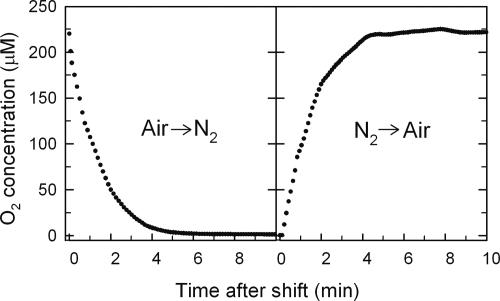
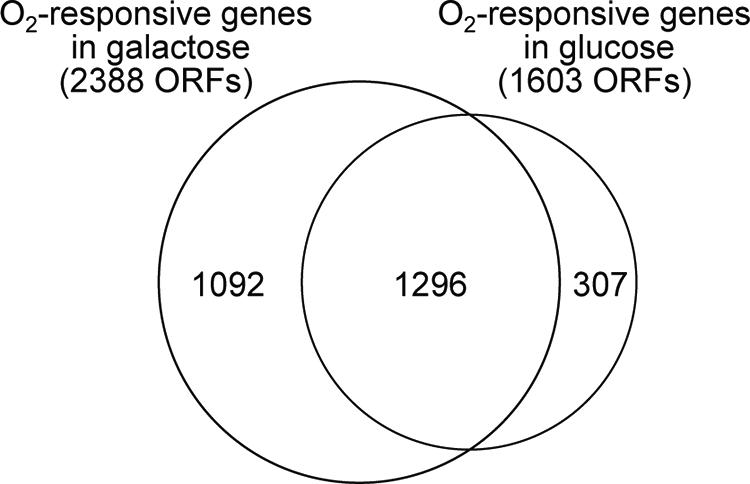
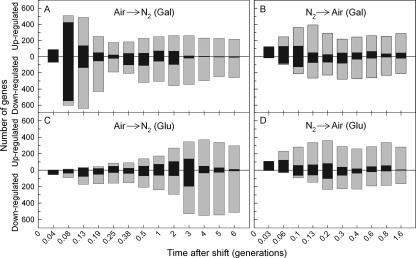
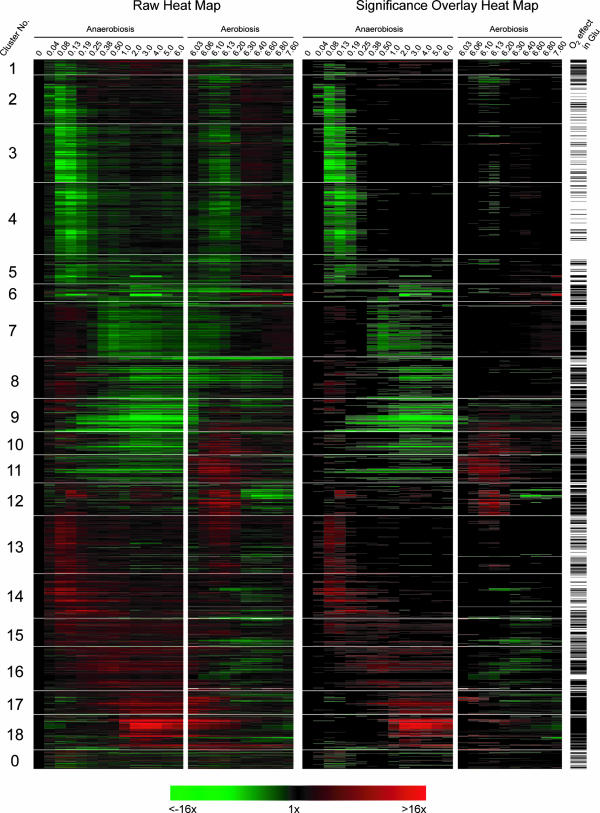
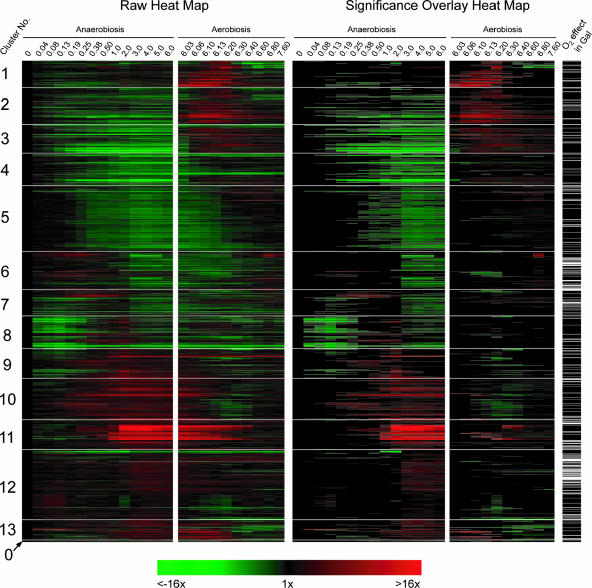
We conducted a comprehensive genomic analysis of the temporal response of yeast to anaerobiosis (six generations) and subsequent aerobic recovery ( approximately 2 generations) to reveal metabolic-state (galactose versus glucose)-dependent differences in gene network activity and function. Analysis of variance showed that far fewer genes responded (raw P value of <or=10(-8)) to the O(2) shifts in glucose (1,603 genes) than in galactose (2,388 genes). Gene network analysis reveals that this difference is due largely to the failure of "stress"-activated networks controlled by Msn2/4, Fhl1, MCB, SCB, PAC, and RRPE to transiently respond to the shift to anaerobiosis in glucose as they did in galactose. After approximately 1 generation of anaerobiosis, the response was similar in both media, beginning with the deactivation of Hap1 and Hap2/3/4/5 networks involved in mitochondrial functions and the concomitant derepression of Rox1-regulated networks for carbohydrate catabolism and redox regulation and ending (>or=2 generations) with the activation of Upc2- and Mot3-regulated networks involved in sterol and cell wall homeostasis. The response to reoxygenation was rapid (<5 min) and similar in both media, dominated by Yap1 networks involved in oxidative stress/redox regulation and the concomitant activation of heme-regulated ones. Our analyses revealed extensive networks of genes subject to combinatorial regulation by both heme-dependent (e.g., Hap1, Hap2/3/4/5, Rox1, Mot3, and Upc2) and heme-independent (e.g., Yap1, Skn7, and Puf3) factors under these conditions. We also uncover novel functions for several cis-regulatory sites and trans-acting factors and define functional regulons involved in the physiological acclimatization to changes in oxygen availability.


Figures

FIG. 1.
FIG. 1.
Transient changes in oxygen concentrations during the shift to anaerobiosis (left panel) and the shift back to aerobiosis (right panel). The change in the dissolved O2 concentration (μM) is plotted as a function of time over the first 10 minutes after switching the sparge gas from air to 2.5% CO2 in O2-free N2 (left panel) and then back to air after 24 h of anaerobiosis (right panel). The O2 concentration was calculated from the dissolved oxygen level measured with a 12-mm Ingold polarographic O2 sensor and is based upon the solubility of O2 in the media at 28°C and ambient barometric pressure.
FIG. 2.
FIG. 2.
Comparison of oxygen-responsive genes identified in galactose and glucose media. The figure shows the overlap in genes that were found to respond significantly (P < 0.01) to the shifts in oxygen availability in galactose and glucose media. ORFs, open reading frames.
FIG. 3.
FIG. 3.
Dynamics of oxygen-responsive gene induction and repression during acclimatization to anaerobiosis and subsequent recovery. The numbers of genes that responded significantly (P < 0.01) to the shifts in O2 availability in galactose (A and B) and glucose (C and D) media are plotted as a function of time (generations) after the shifts. Genes are divided into those that were significantly up-regulated and those that were significantly down-regulated. Black bars indicate the number of genes that were identified for the first time at that time point to exhibit a significant change in expression from that of the aerobic (A and C) or anaerobic (B and D) controls. Gray bars indicate the number of genes that were differentially expressed in the sample but that had already been identified to have responded significantly to the shift in O2 concentration at an earlier time point. The combined height of the black and gray bars is the total number of genes at each time point that showed a significant difference in expression relative to controls.
FIG. 4.
FIG. 4.
Assessment of clustering quality using the FCS and CS for oxygen-responsive genes identified in galactose medium. The temporal profiles of genes that responded significantly (P < 0.01) to the shifts in oxygen availability in galactose medium (SSG-TEA) were clustered 10 times using an SOM algorithm with 1D ring topology and Pearson correlation as the distance metric. The average FCS P values (solid line, left ordinate) for 2,603 transcription factor consensus binding sequences (TFMs) and CS (dotted line, right ordinate) are plotted as a function of cluster number (K). CS is the percentage of genes that were consistently grouped together over 10 runs of the algorithm. FCS is the probability that the observed configuration of TFMs among gene clusters arose by chance alone from the multinomial distribution dictated by cluster sizes.
FIG. 5.
FIG. 5.
Heat maps and statistical comparisons of oxygen-responsive genes identified in galactose medium. The temporal profiles of genes that responded significantly (P < 0.01) to the shift to either anaerobiosis or aerobiosis in SSG-TEA medium were clustered using an SOM algorithm with 1D ring topology (K = 18). The left panel shows the temporal signatures, and the right panel shows the same temporal signatures but with a statistical overlay that masks gene expression changes that were not significantly (P > 0.01) different from the controls (aerobic sample for anaerobiosis and sixth-generation anaerobic sample for aerobiosis). Cluster 0 contains genes that were not consistently placed in the same cluster over 10 replicate runs of the SOM algorithm. Green indicates down-regulated expression, and red indicates up-regulated expression. Bars to the right of the heat map indicate genes that also responded significantly (P < 0.01) to the shift in O2 availability in glucose medium.
FIG. 6.
FIG. 6.
Assessment of clustering quality using the FCS and CS for oxygen-responsive genes identified in glucose medium. The temporal profiles of genes that responded significantly (P < 0.01) to the shifts in oxygen availability in glucose medium (SSD-TEA) were clustered 10 times using an SOM algorithm with 1D ring topology and Pearson correlation as the distance metric. The average FCS P values (solid line, left ordinate) for 2,603 transcription factor consensus binding sequences (TFMs) and CS (dotted line, right ordinate) are plotted as a function of the cluster number (K).
FIG. 7.
FIG. 7.
Heat maps and statistical comparisons of oxygen-responsive genes identified in glucose medium. The temporal profiles of genes that responded significantly (P < 0.01) to the shift to either anaerobiosis or aerobiosis in SSD-TEA medium were clustered using an SOM algorithm with 1D ring topology (K = 13). The left panel shows the temporal signatures, and the right panel shows the same temporal signatures but with a statistical overlay that masks gene expression changes that were not significantly (P > 0.01) different from the controls (aerobic sample for anaerobiosis and sixth-generation anaerobic sample for aerobiosis). Cluster 0 contains genes that exhibited unstable cluster membership. Green indicates down-regulated expression, and red indicates up-regulated expression. Bars to the right of the heat map indicate genes that also responded significantly (P < 0.01) to the shift in O2 availability in galactose medium.

Similar articles

Cited by

References

    1. Acton, T. B., H. Zhong, and A. K. Vershon. 1997. DNA-binding specificity of Mcm1: operator mutations that alter DNA-bending and transcriptional activities by a MADS box protein. Mol. Cell. Biol. 17:1881-1889. - PMC - PubMed
    1. Anderson, J. S. J., and R. Parker. 2000. Computational identification of cis-acting elements affecting post-transcriptional control of gene expression in Saccharomyces cerevisiae. Nucleic Acids Res. 28:1604-1617. - PMC - PubMed
    1. Andreasen, A., and T. Stier. 1953. Anaerobic nutrition of Saccharomyces cerevisiae. I. Ergosterol requirement for growth in a defined medium. J. Cell. Comp. Physiol. 41:23-36. - PubMed
    1. Andreasen, A., and T. Stier. 1954. Anaerobic nutrition of Saccharomyces cerevisiae. II. Unsaturated fatty acid requirement for growth in defined medium. J. Cell. Comp. Physiol. 43:271-281. - PubMed
    1. Bailey, T. L., and C. Elkan. 1994. Fitting a mixture model by expectation maximization to discover motifs in biopolymers. Proc. Int. Conf. Intell. Syst. Mol. Biol. 2:28-36. - PubMed

Publication types

MeSH terms