Comparative Study
. 2006 Oct;16(10):1208-21.
doi: 10.1101/gr.4997306. Epub 2006 Sep 8.

Comparative genomics modeling of the NRSF/REST repressor network: from single conserved sites to genome-wide repertoire

Affiliations
Comparative Study

Comparative genomics modeling of the NRSF/REST repressor network: from single conserved sites to genome-wide repertoire

Ali Mortazavi et al. Genome Res. 2006 Oct.

Abstract

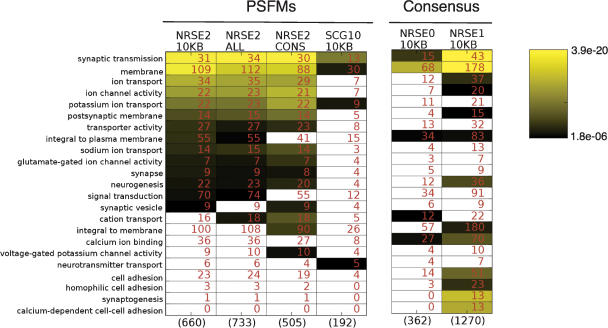
We constructed and applied an open source informatic framework called Cistematic in an effort to predict the target gene repertoire for transcription factors with large binding sites. Cistematic uses two different evolutionary conservation-filtering algorithms in conjunction with several analysis modules. Beginning with a single conserved and biologically tested site for the neuronal repressor NRSF/REST, Cistematic generated a refined PSFM (position specific frequency matrix) based on conserved site occurrences in mouse, human, and dog genomes. Predictions from this model were validated by chromatin immunoprecipitation (ChIP) followed by quantitative PCR. The combination of transfection assays and ChIP enrichment data provided an objective basis for setting a threshold for membership and rank-ordering a final gene cohort model consisting of 842 high-confidence sites in the human genome associated with 733 genes. Statistically significant enrichment of NRSE-associated genes was found for neuron-specific Gene Ontology (GO) terms and neuronal mRNA expression profiles. A more extensive evolutionary survey showed that NRSE sites matching the PSFM model exist in roughly similar numbers in all fully sequenced vertebrate genomes but are notably absent from invertebrate and protochordate genomes, as is NRSF itself. Some NRSF/REST sites reside in repeats, which suggests a mechanism for both ancient and modern dispersal of NRSEs through vertebrate genomes. Multiple predicted sites are located near neuronal microRNA and splicing-factor genes, and these tested positive for NRSF/REST occupancy in vivo. The resulting network model integrates post-transcriptional and translational controllers, including candidate feedback loops on NRSF and its corepressor, CoREST.


Figures

Figure 1.
Figure 1.
Experimental approach. (A) Results from genome-wide matches to the initial NRSE PSFM (SCG10) were analyzed with cisMatcher and used to create a refined NRSE PSFM (NRSE2). (B) A refinement starting with a PSFM of 33 known sites (Supplemental Table S2) produces a result very similar to NRSE2. (C) The genome was searched for occur- rences of NRSE1, using its consensus (TYAGMRCCNNRGMSAG) (Bruce et al. 2004); or NRSE2, using its position-specific frequency matrix (PSFM). Resulting NRSE1 and NRSE2 gene cohorts were then analyzed for Gene Ontology (GO) enrichment and expression analysis as follows: (1) the NRSE2 PSFM was further processed and analyzed for GO enrichment and expression analysis of two subsets; (2) human genes with matches that co-occur in mouse and/or dog, and (3) human genes that are nearest to the “most conserved” matches, as identified by cisMatcher.
Figure 2.
Figure 2.
Different seed motifs converge following motif refinement. (A) A total of 10 initial seed motifs from known or predicted sites are compared using the motif similarity score (see Methods) to our starting motif (SCG10) as well as a PSFM of 33 known instances (NRSEpsfm33) and its refined version (NRSEpsfm33+R). The correlations median is 0.80. (B) Motif refinement of SCG10 (called NRSE2) and of the 10 initial motifs (denoted with a +R) are markedly more similar, with a motif correlations median of 0.91 with several intermotif correlations rising above 0.95.
Figure 3.
Figure 3.
Selection of a threshold for NRSE2 and correlation of score with repression activity. (A) The 33 known instances (▲) and four false positives (filled ovals) listed in Table S1 were scored with the NRSE2 PSFM using a consensus score, as described in the text and methods. A threshold of 84% of the best possible score (match #5) was selected conservatively to exclude the known false positives. The PSFMs exclude about 6% of known instances at this relatively high threshold. (B) The NRSE2 PSFM score of 10 known instances and three false positives were plotted against their relative repression in a transient transfection of a reporter from Schoenherr et al. (1996), where 100% and above reporter activity represents no repression. The regression shows a marked correlation between PSFM match score and repression (R2 = 0.82).
Figure 4.
Figure 4.
Quantitative analysis of chromatin immunoprecipitation of NRSF. (A) A total of 113 potential NRSE2 matches, 42 of which fell below our threshold of 84% (green vertical line), were assayed using ChIP followed by quantitative PCR. Fold enrichments were calculated by dividing the absolute number of genomic equivalents of each NRSE by the mean of the recovered amounts of five random nongenic, nonconserved regions. Fold enrichments that were above three standard deviations from the mean of the five random nongenic amounts (red line, 2.44 × enrichment), were considered to be occupied sites. An exponential regression (black line in this semilog plot), which would correspond to the regression in Figure 2B, accounts for about half of the data's variation (R2 = 0.56). A total of 13 of the 83 occupied sites (16%) fell below our 84% threshold. (B) Cumulative normal distribution function of probit coefficient vs. score with 95% confidence levels shown by dashes. The estimated chance of a success match goes up by nearly half between 80% and 84%.
Figure 5.
Figure 5.
Gene Ontology enrichment comparison of different NRSE cis-regulatory cohorts. Cohorts of human genes within 10 kb of a candidate NRSE0 (Schoenherr et al. 1996), NRSE1 (Bruce et al. 2004), SCG10 (the original seed motif), NRSE2, All NRSE2 matches, and conserved NRSE2 matches were filtered of repeat matches and were analyzed for GO term overrepresentation. Significantly enriched GO terms in at least one of the cohorts (of 4576 possible GO terms) are shown. Numbers in cells represent the genes with the term in the cohort, while numbers in parentheses represent the cohort size. Cells shown in color pass the threshold of significance, as determined by a Bonferroni correction. GO terms are sorted in decreasing order by P-values of the leftmost column. Note that GO enrichments are in terms of decrease in P-values, which are directly correlated to the size of the cohorts; the number of genes in the shared association cohort with a particular GO term may go down or stay the same, while its significance increases. The NRSE1 motif behaves differently from the other definitions, as seen in the enrichment of synaptogenesis, which is the result of weak matches within the paralogous protocadherin β family.
Figure 6.
Figure 6.
Tissue expression pattern of NRSE associated-genes shows brain-specific expression enrichment. (A) Human genes with an NRSE2 (listed in Supplemental Table S2) with an expression pattern in the GNF survey of 79 human tissues, were clustered using the k-medians algorithm as described in the Methods. The second and fifth clusters, which encompass 40% of the NRSE2-associated genes show a clear, brain-specific expression pattern. (B) Weights of the k-medoid for cluster 2, with brain tissues highlighted in black. Note that cardiac myocytes and pancreatic islet cells also have positive weights. (C) NRSE2 shows a 3.5-fold enrichment of “brain specific” genes (as defined by the medoid in B) compared with the GNF data sets, and shows greater enrichment than NRSE1. (D) NRSE0 (top), NRSE1, and NRSE2 matches associated with genes than have a greater than 0.4 correlation with the medoid vector in B. NRSE1 shows a double-humped distribution of matches, with matches weaker than 77% accounting for half of its matches; these low scoring matches are likely false-positives.
Figure 7.
Figure 7.
NRSE distribution in vertebrate and invertebrate genomes. (A) The number of NRSE2 matches in mammalian genomes is relatively constant and includes a significant number of matches within repeats when compared with other vertebrates and compared with the virtual absence of NRSE2 matches in invertebrates. (B) The higher density of all NRSE matches/Mb of genomic sequences in pufferfish and zebrafish when compared with chicken suggest that fish and mammalian NRSE matches may have been expanding independently. Refer to Supplemental Table 5 for the number of matches and the genome size for each genome.
Figure 8.
Figure 8.
NRSF gene regulatory network model. (A) NRSF in conjuction with CoREST and other corepressors prevents the transcription of several hundred targets, including neuronal splicing factors, transcription factors, and microRNAs, as well as many terminal differentiation genes in a stem cell. (B) Upon receiving neurogenic signals to terminally differentiate, the NRSF protein is degraded, which leads to derepression of its targets, which are now available to activators. In particular, the NRSE- associated miR-153, which is embedded in the pan-neuronal gene PTPRN that has a NRSE in one of its introns, is predicted to down-regulate both NRSF and CoREST mRNAs (which is also the predicted target of the NRSE-associated miR-29b and miR-124a), thus maintaining the derepression.

References

    1. Abderrahmani A., Steinmann M., Plaisance V., Niederhauser G., Haefliger J.A., Mooser V., Bonny C., Nicod P., Waeber G., Steinmann M., Plaisance V., Niederhauser G., Haefliger J.A., Mooser V., Bonny C., Nicod P., Waeber G., Plaisance V., Niederhauser G., Haefliger J.A., Mooser V., Bonny C., Nicod P., Waeber G., Niederhauser G., Haefliger J.A., Mooser V., Bonny C., Nicod P., Waeber G., Haefliger J.A., Mooser V., Bonny C., Nicod P., Waeber G., Mooser V., Bonny C., Nicod P., Waeber G., Bonny C., Nicod P., Waeber G., Nicod P., Waeber G., Waeber G. The transcriptional repressor REST determines the cell-specific expression of the human MAPK8IP1 gene encoding IB1 (JIP-1) Mol. Cell. Biol. 2001;21:7256–7267. - PMC - PubMed
    1. Andres M.E., Burger C., Peral-Rubio M.J., Battaglioli E., Anderson M.E., Grimes J., Dallman J., Ballas N., Mandel G., Burger C., Peral-Rubio M.J., Battaglioli E., Anderson M.E., Grimes J., Dallman J., Ballas N., Mandel G., Peral-Rubio M.J., Battaglioli E., Anderson M.E., Grimes J., Dallman J., Ballas N., Mandel G., Battaglioli E., Anderson M.E., Grimes J., Dallman J., Ballas N., Mandel G., Anderson M.E., Grimes J., Dallman J., Ballas N., Mandel G., Grimes J., Dallman J., Ballas N., Mandel G., Dallman J., Ballas N., Mandel G., Ballas N., Mandel G., Mandel G. CoREST: A functional corepressor required for regulation of neural-specific gene expression. Proc. Natl. Acad. Sci. 1999;96:9873–9878. - PMC - PubMed
    1. Atouf F., Czernichow P., Scharfmann R., Czernichow P., Scharfmann R., Scharfmann R. Expression of neuronal traits in pancreatic β cells—Implication ofneuron-restrictive silencing factor/repressor element silencing transcription factor, a neuron-restrictive silencer. J. Biol. Chem. 1997;272:1929–1934. - PubMed
    1. Ballas N., Grunseich C., Lu D.D., Speh J.C., Mandel G., Grunseich C., Lu D.D., Speh J.C., Mandel G., Lu D.D., Speh J.C., Mandel G., Speh J.C., Mandel G., Mandel G. REST and its corepressors mediate plasticity of neuronal gene chromatin throughout neurogenesis. Cell. 2005;121:645–657. - PubMed
    1. Boffelli D., Weer C.V., Weng L., Lewis K.D., Shoukry M.I., Pachter L., Keys D.N., Rubin E.M., Weer C.V., Weng L., Lewis K.D., Shoukry M.I., Pachter L., Keys D.N., Rubin E.M., Weng L., Lewis K.D., Shoukry M.I., Pachter L., Keys D.N., Rubin E.M., Lewis K.D., Shoukry M.I., Pachter L., Keys D.N., Rubin E.M., Shoukry M.I., Pachter L., Keys D.N., Rubin E.M., Pachter L., Keys D.N., Rubin E.M., Keys D.N., Rubin E.M., Rubin E.M. Intraspecies sequence comparisons for annotating genomes. Genome Res. 2004;14:2406–2411. - PMC - PubMed

Publication types

MeSH terms

LinkOut - more resources