Genomic organization of the Drosophila telomere retrotransposable elements
- PMID: 16963706
- PMCID: PMC1581432
- DOI: 10.1101/gr.5348806
Genomic organization of the Drosophila telomere retrotransposable elements
Abstract
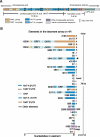
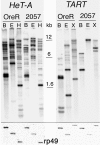
The emerging sequence of the heterochromatic portion of the Drosophila melanogaster genome, with the most recent update of euchromatic sequence, gives the first genome-wide view of the chromosomal distribution of the telomeric retrotransposons, HeT-A, TART, and Tahre. As expected, these elements are entirely excluded from euchromatin, although sequence fragments of HeT-A and TART 3 untranslated regions are found in nontelomeric heterochromatin on the Y chromosome. The proximal ends of HeT-A/TART arrays appear to be a transition zone because only here do other transposable elements mix in the array. The sharp distinction between the distribution of telomeric elements and that of other transposable elements suggests that chromatin structure is important in telomere element localization. Measurements reported here show (1) D. melanogaster telomeres are very long, in the size range reported for inbred mouse strains (averaging 46 kb per chromosome end in Drosophila stock 2057). As in organisms with telomerase, their length varies depending on genotype. There is also slight under-replication in polytene nuclei. (2) Surprisingly, the relationship between the number of HeT-A and TART elements is not stochastic but is strongly correlated across stocks, supporting the idea that the two elements are interdependent. Although currently assembled portions of the HeT-A/TART arrays are from the most-proximal part of long arrays, approximately 61% of the total HeT-A sequence in these regions consists of intact, potentially active elements with little evidence of sequence decay, making it likely that the content of the telomere arrays turns over more extensively than has been thought.
Figures


Similar articles
-
Heterochromatic distribution of HeT-A- and TART-like sequences in several Drosophila species.Cytogenet Genome Res. 2005;110(1-4):124-33. doi: 10.1159/000084944. Cytogenet Genome Res. 2005. PMID: 16093664
-
Drosophila telomeres: two transposable elements with important roles in chromosomes.Genetica. 1999;107(1-3):189-96. Genetica. 1999. PMID: 10952212
-
Two distinct domains in Drosophila melanogaster telomeres.Genetics. 2005 Dec;171(4):1767-77. doi: 10.1534/genetics.105.048827. Epub 2005 Sep 2. Genetics. 2005. PMID: 16143601 Free PMC article.
-
Drosophila telomere transposons: genetically active elements in heterochromatin.Genetica. 2000;109(1-2):45-52. doi: 10.1023/a:1026540301503. Genetica. 2000. PMID: 11293794 Review.
-
Euchromatic and heterochromatic domains at Drosophila telomeres.Biochem Cell Biol. 2005 Aug;83(4):477-85. doi: 10.1139/o05-053. Biochem Cell Biol. 2005. PMID: 16094451 Review.
Cited by
-
Transposable Elements as a Source of Novel Repetitive DNA in the Eukaryote Genome.Cells. 2022 Oct 26;11(21):3373. doi: 10.3390/cells11213373. Cells. 2022. PMID: 36359770 Free PMC article. Review.
-
Specific Localization of the Drosophila Telomere Transposon Proteins and RNAs, Give Insight in Their Behavior, Control and Telomere Biology in This Organism.PLoS One. 2015 Jun 12;10(6):e0128573. doi: 10.1371/journal.pone.0128573. eCollection 2015. PLoS One. 2015. PMID: 26068215 Free PMC article.
-
Role of piRNAs in the Drosophila telomere homeostasis.Mob Genet Elements. 2011 Nov 1;1(4):274-278. doi: 10.4161/mge.18301. Mob Genet Elements. 2011. PMID: 22545238 Free PMC article.
-
Long non-coding RNAs involved in Drosophila development and regeneration.NAR Genom Bioinform. 2024 Aug 16;6(3):lqae091. doi: 10.1093/nargab/lqae091. eCollection 2024 Sep. NAR Genom Bioinform. 2024. PMID: 39157585 Free PMC article.
-
Multiple pathways suppress telomere addition to DNA breaks in the Drosophila germline.Genetics. 2012 Jun;191(2):407-17. doi: 10.1534/genetics.112.138818. Epub 2012 Mar 23. Genetics. 2012. PMID: 22446318 Free PMC article.
References
-
- Abad J.P., De Pablos B., Osoegawa K., De Jong P.J., Martin-Gallardo A., Villasante A., De Pablos B., Osoegawa K., De Jong P.J., Martin-Gallardo A., Villasante A., Osoegawa K., De Jong P.J., Martin-Gallardo A., Villasante A., De Jong P.J., Martin-Gallardo A., Villasante A., Martin-Gallardo A., Villasante A., Villasante A. Genomic analysis of Drosophila melanogaster telomeres: Full-length copies of HeT-A and TART elements at telomeres. Mol. Biol. Evol. 2004a;21:1613–1619. - PubMed
-
- Abad J.P., De Pablos B., Osoegawa K., De Jong P.J., Martin-Gallardo A., Villasante A., De Pablos B., Osoegawa K., De Jong P.J., Martin-Gallardo A., Villasante A., Osoegawa K., De Jong P.J., Martin-Gallardo A., Villasante A., De Jong P.J., Martin-Gallardo A., Villasante A., Martin-Gallardo A., Villasante A., Villasante A. TAHRE, a novel telomeric retrotransposon from Drosophila melanogaster, reveals the origin of Drosophila telomeres. Mol. Biol. Evol. 2004b;21:1620–1624. - PubMed
-
- Adams M.D., Celniker S.E., Holt R.A., Evans C.A., Gocayne J.D., Amanatides P.G., Scherer S.E., Li P.W., Hoskins R.A., Galle R.F., Celniker S.E., Holt R.A., Evans C.A., Gocayne J.D., Amanatides P.G., Scherer S.E., Li P.W., Hoskins R.A., Galle R.F., Holt R.A., Evans C.A., Gocayne J.D., Amanatides P.G., Scherer S.E., Li P.W., Hoskins R.A., Galle R.F., Evans C.A., Gocayne J.D., Amanatides P.G., Scherer S.E., Li P.W., Hoskins R.A., Galle R.F., Gocayne J.D., Amanatides P.G., Scherer S.E., Li P.W., Hoskins R.A., Galle R.F., Amanatides P.G., Scherer S.E., Li P.W., Hoskins R.A., Galle R.F., Scherer S.E., Li P.W., Hoskins R.A., Galle R.F., Li P.W., Hoskins R.A., Galle R.F., Hoskins R.A., Galle R.F., Galle R.F., et al. The genome sequence of Drosophila melanogaster . Science. 2000;287:2185–2195. - PubMed
-
- Askree A.H., Yehuda T., Smolikov S., Gurevich R., Hawk J., Coker C., Krauskopf A., Kupiec M., McEachern M.J., Yehuda T., Smolikov S., Gurevich R., Hawk J., Coker C., Krauskopf A., Kupiec M., McEachern M.J., Smolikov S., Gurevich R., Hawk J., Coker C., Krauskopf A., Kupiec M., McEachern M.J., Gurevich R., Hawk J., Coker C., Krauskopf A., Kupiec M., McEachern M.J., Hawk J., Coker C., Krauskopf A., Kupiec M., McEachern M.J., Coker C., Krauskopf A., Kupiec M., McEachern M.J., Krauskopf A., Kupiec M., McEachern M.J., Kupiec M., McEachern M.J., McEachern M.J. A genome-wide screen for Saccharomyces cerevisiae deletion mutants that affect telomere length. Proc. Natl. Acad. Sci. 2004;101:8658–8663. - PMC - PubMed
Publication types
MeSH terms
Substances
Grants and funding
LinkOut - more resources
Full Text Sources
Molecular Biology Databases
Research Materials
