. 2006 Sep 11:7:231.
doi: 10.1186/1471-2164-7-231.

Discovery and validation of breast cancer subtypes

Affiliations

Discovery and validation of breast cancer subtypes

Amy V Kapp et al. BMC Genomics. .

Erratum in

  • BMC Genomics. 2007 Apr 13;8(1):101

Abstract

Background: Previous studies demonstrated breast cancer tumor tissue samples could be classified into different subtypes based upon DNA microarray profiles. The most recent study presented evidence for the existence of five different subtypes: normal breast-like, basal, luminal A, luminal B, and ERBB2+.

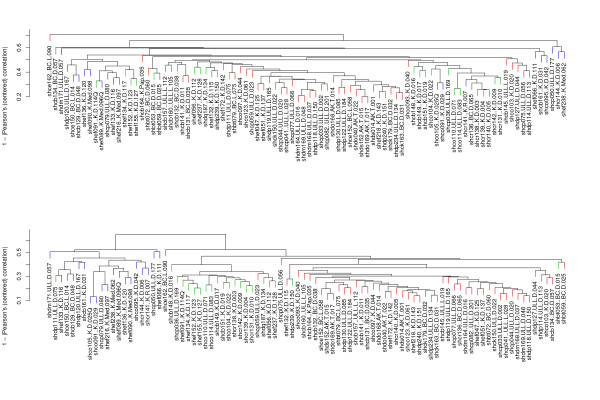
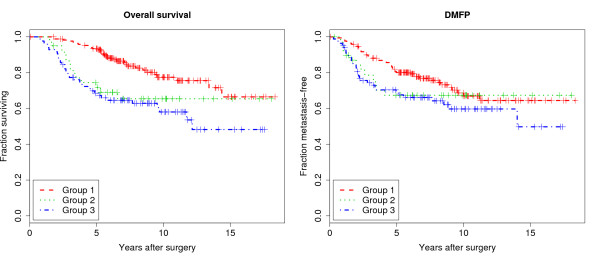
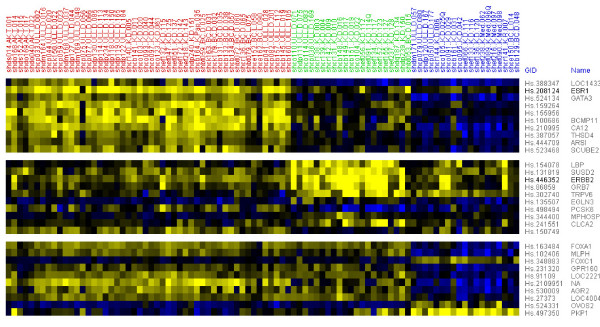
Results: Based upon the analysis of 599 microarrays (five separate cDNA microarray datasets) using a novel approach, we present evidence in support of the most consistently identifiable subtypes of breast cancer tumor tissue microarrays being: ESR1+/ERBB2-, ESR1-/ERBB2-, and ERBB2+ (collectively called the ESR1/ERBB2 subtypes). We validate all three subtypes statistically and show the subtype to which a sample belongs is a significant predictor of overall survival and distant-metastasis free probability.

Conclusion: As a consequence of the statistical validation procedure we have a set of centroids which can be applied to any microarray (indexed by UniGene Cluster ID) to classify it to one of the ESR1/ERBB2 subtypes. Moreover, the method used to define the ESR1/ERBB2 subtypes is not specific to the disease. The method can be used to identify subtypes in any disease for which there are at least two independent microarray datasets of disease samples.


Figures

Figure 1
Figure 1
Hierarchical clusterings of training dataset. Hierarchical clustering of all the training dataset samples (upper) on all 23,9946 genes and (lower) on the 1,908 genes that define the three ERBB2/ESR1 subtype centroids. In both dendrograms, the training dataset samples are colored according to which ESR1/ERBB2 subtype they belong. ESR1+/ERBB2- samples are in red; ERBB2+ samples are in green; and ESR1-/ERBB2- samples are in blue.
Figure 2
Figure 2
Kaplan-Meier curves for overall survival and DMFP for the three groups defined by BCMP11/ABCC11. The Kaplan-Meier survival curves (left) and DMFP curves (right) for each of the three groups defined by BCMP11 and ABCC11.
Figure 3
Figure 3
Kaplan-Meier curves for overall survival and DMFP for the three groups defined by SLC39A6/GATA3. The Kaplan-Meier survival curves (left) and DMFP curves (right) for each of the three groups defined by SLC39A6 and GATA3.
Figure 4
Figure 4
Histograms of correlations between significantly differentially expressed genes and the genes that induced them. (Left) Histogram of the maximum absolute Pearson's (centered) correlation of the genes that are significantly differentially expressed between the BCMP11/ABCC11 groups with BCMP11 and with ABCC11. (Right) Histogram of the maximum absolute Pearson's (centered) correlation of the genes that are significantly differentially expressed between the GATA3/SLC39A6 groups with GATA3 and with SLC39A6.
Figure 5
Figure 5
Training dataset samples dendrogram clustered on BCMP11/ABCC11 centroid genes. Thirty centroid genes present in all datasets that best distinguish the three BCMP11/ABCC11 groups. The first group of genes are the top ten genes that distinguish Group 1 from Groups 2 and 3; the second group of genes are the top ten genes that distinguish Group 2 from Groups 1 and 3; and the last group of genes are the top ten genes that distinguish Group 3 from Groups 1 and 2. The samples in BCMP11/ABCC11 Group 1 (ERBB2-/ESR1+) are in red; the samples in BCMP11/ABCC11 Group 2 (ERBB2+) are in green; and the samples in the BCMP11/ABCC11 Group 3 (ESR1-/ERBB2-) are in blue.
Figure 6
Figure 6
Training and testing datasets formation. This diagram shows how the training dataset and testing dataset were formed. For the top row, the numbers in the boxes represent the number of samples that were combined to form the training dataset and testing dataset. The arrows point to the dataset in which they were put.
Figure 7
Figure 7
Steps of the procedure. Pictorial representation of steps 1 – 5 described in the Procedure subsection of the Methods section. (Upper) Filter all 23,946 genes by removing genes with at least 10% missing data or a standard deviation less than 1.5. Keep all seed genes that define two training dataset sample groups between which at least one of the 23,946 genes is significantly differentially expressed. Repeatedly do the following steps. Select two of the 133 candidate genes and hierarchically cluster the training dataset sample on these two genes. Cut the dendrogram from the top down to produce three groups of samples. Cut the same dendrogram from the top down again to produce four groups of samples. Use PAM to determine which of the 23,946 genes best define centroids for the training dataset sample groups obtained from the dendrogram. Form the centroids by taking only the data for those genes and averaging over the sample classified to the same group. Use the centroids to classify the training dataset samples. (Lower) If all the groups are validated in the training dataset then use the centroids to classify the testing datasets' samples. If all the groups are validated in all of the validation datasets, then the significance of the groups' clinical difference is determined (not pictured).

Similar articles

Cited by

References

    1. Perou CM, Sørlie T, Eisen MB, van de Rijn M, Jeffrey SS, Rees CA, Pollack JR, Ross DT, Johnsen H, Akslen LA, Fluge Ø, Pergamenschikov A, Williams C, Zhu SX, Lønning PE, Børresen-Dale AL, Brown PO, Botstein D. Molecular portraits of human breast tumours. Nature. 2000;406:747–752. doi: 10.1038/35021093. - DOI - PubMed
    1. Sørlie T, Perou CM, Tibshirani R, Aas T, Geisler S, Johnsen H, Hastie T, Eisen MB, van de Rijn M, Jeffrey SS, Thorsen T, Quist H, Matese JC, Brown PO, Botstein D, Lønning PE, Børresen-Dale AL. Gene expression patterns of breast carcinomas distinguish tumor subclasses with clinical implications. Proc Natl Acad Sci U S A. 2001;98:10869–10874. doi: 10.1073/pnas.191367098. - DOI - PMC - PubMed
    1. Sørlie T, Tibshirani R, Parker J, Hastie T, Marron JS, Nobel A, Deng S, Johnsen H, Pesich R, Geisler S, Demeter J, Perou CM, Lønning PE, Brown PO, Børresen-Dale AL, Botstein D. Repeated observation of breast tumor subtypes in independent gene expression data sets. Proc Natl Acad Sci U S A. 2003;100:8418–8423. doi: 10.1073/pnas.0932692100. - DOI - PMC - PubMed
    1. Kapp AV, Tibshirani R. Are clusters found in one dataset present in another dataset? Biostatistics. 2006 - PubMed
    1. Fletcher G, Patel S, Tyson K, Adam P, Schenker M, Loader J, Daviet L, Legrain P, Parekh R, Harris A, Terrett J. hAG-2 and hAG-3, human homologues of genes involved in differentiation, are associated with oestrogen receptor-positive breast tumors and interact with metastasis gene C4.4a and dystroglycan. Br J Cancer. 2003;88:579–585. doi: 10.1038/sj.bjc.6600740. - DOI - PMC - PubMed

Publication types

MeSH terms