

GIS approaches for the estimation of residential-level ambient PM concentrations
- PMID: 16966091
- PMCID: PMC1570082
- DOI: 10.1289/ehp.9169
GIS approaches for the estimation of residential-level ambient PM concentrations
Abstract
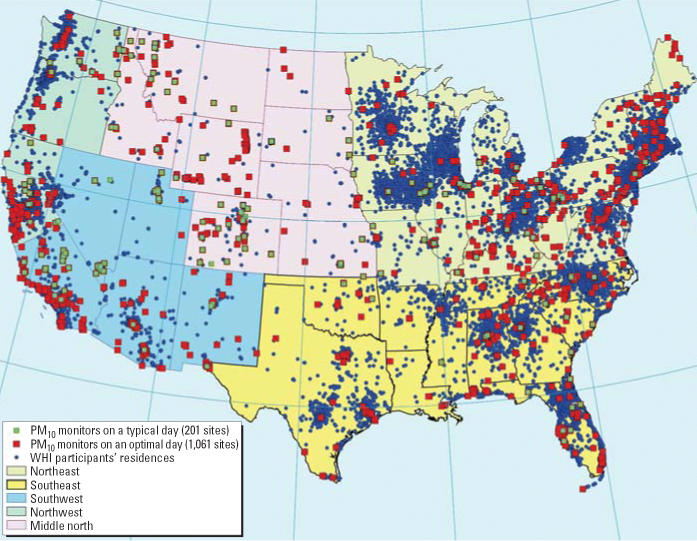
Spatial estimations are increasingly used to estimate geocoded ambient particulate matter (PM) concentrations in epidemiologic studies because measures of daily PM concentrations are unavailable in most U.S. locations. This study was conducted to a) assess the feasibility of large-scale kriging estimations of daily residential-level ambient PM concentrations, b) perform and compare cross-validations of different kriging models, c) contrast three popular kriging approaches, and d) calculate SE of the kriging estimations. We used PM data for PM with aerodynamic diameter </= 10 microm (PM10) and aerodynamic diameter </= 2.5 microm (PM2.5) from the U.S. Environmental Protection Agency for the year 2000. Kriging estimations were performed at 94,135 geocoded addresses of Women's Health Initiative study participants using the ArcView geographic information system. We developed a semiautomated program to enable large-scale daily kriging estimation and assessed validity of semivariogram models using prediction error (PE) , standardized prediction error (SPE) , root mean square standardized (RMSS) , and SE of the estimated PM. National- and regional-scale kriging performed satisfactorily, with the former slightly better. The average PE, SPE, and RMSS of daily PM10 semivariograms using regular ordinary kriging with a spherical model were 0.0629, -0.0011, and 1.255 microg/m3, respectively ; the average SE of the estimated residential-level PM10 was 27.36 microg/m3. The values for PM2.5 were 0.049, 0.0085, 1.389, and 4.13 microg/m3, respectively. Lognormal ordinary kriging yielded a smaller average SE and effectively eliminated out-of-range predicted values compared to regular ordinary kriging. Semiautomated daily kriging estimations and semivariogram cross-validations are feasible on a national scale. Lognormal ordinary kriging with a spherical model is valid for estimating daily ambient PM at geocoded residential addresses.
Figures
Comment in
-
Validating national kriging exposure estimation.Environ Health Perspect. 2007 Jul;115(7):A338; author reply A338-9. doi: 10.1289/ehp.10205R. Environ Health Perspect. 2007. PMID: 17637891 Free PMC article. No abstract available.
References
-
- Abbey DE, Moore J, Petersen F, Beeson L. Estimating cumulative ambient concentrations of air pollutants: description and precision of methods used for an epidemiological study. Arch Environ Health. 1991;46:281–287. - PubMed
-
- Abbey DE, Nishino N, McDonnell WF, Burchette RJ, Knutsen SF, Lawrence Beeson W, et al. Long-term inhalable particles and other air pollutants related to mortality in nonsmokers. Am J Respir Crit Care Med. 1999;159:373–382. - PubMed
-
- Cressie NAC. 1993a. Geostatistics. In: Statistics for Spatial Data (Cressie NAC, ed). New York:John Wiley & Sons, 29–104.
-
- Cressie NAC. 1993b. Spatial prediction and kriging. In: Statistics for Spatial Data (Cressie NAC, ed). New York:John Wiley & Sons, 105–209.
-
- Davis JC. 2002. Analysis of sequences of data. In: Statistics and Data Analysis in Geography (Davis JC, ed). 3rd ed. New York:John Wiley & Sons, 159–292.
Publication types
MeSH terms
Substances
Grants and funding
LinkOut - more resources
Full Text Sources
Medical