. 2006 Nov;26(22):8316-35.
doi: 10.1128/MCB.00671-06. Epub 2006 Sep 11.

Requirement of hCenexin for proper mitotic functions of polo-like kinase 1 at the centrosomes

Affiliations

Requirement of hCenexin for proper mitotic functions of polo-like kinase 1 at the centrosomes

Nak-Kyun Soung et al. Mol Cell Biol. 2006 Nov.

Abstract

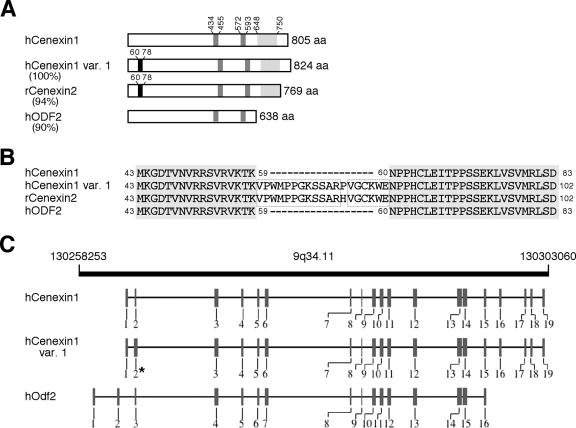
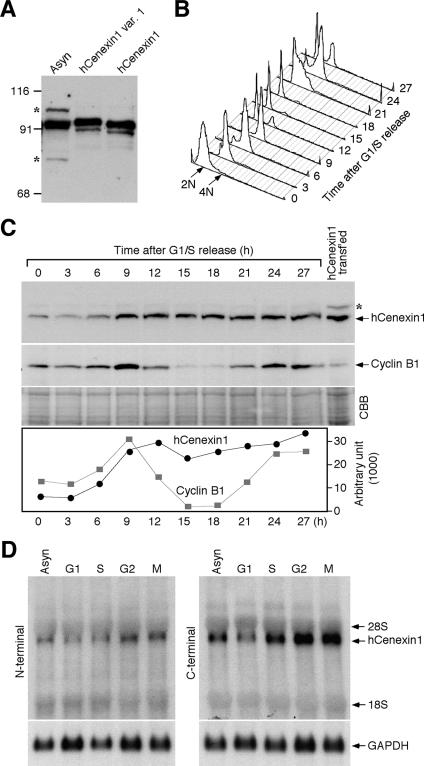
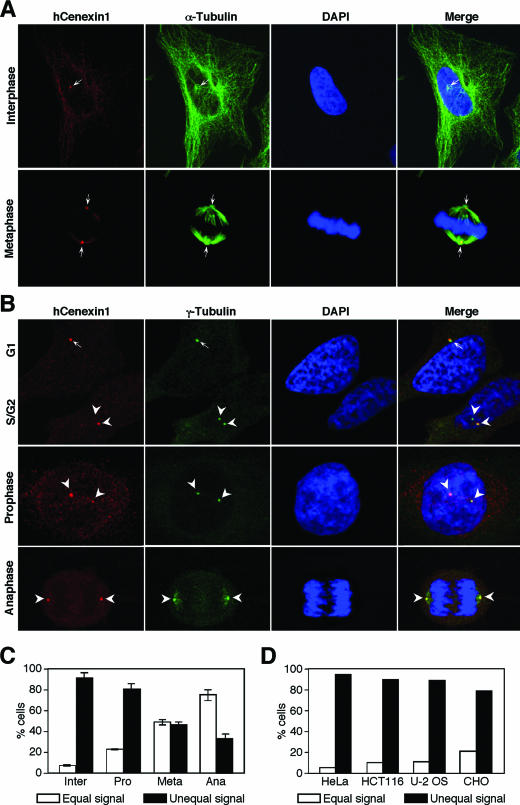
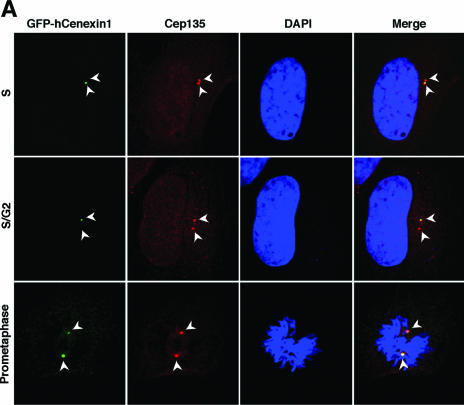
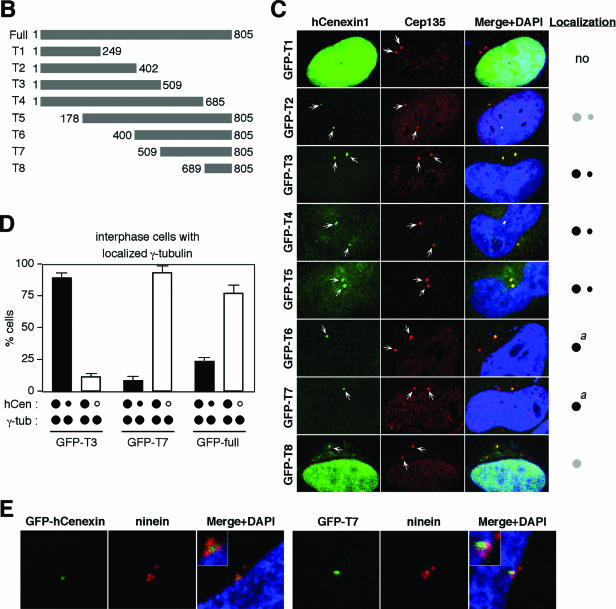
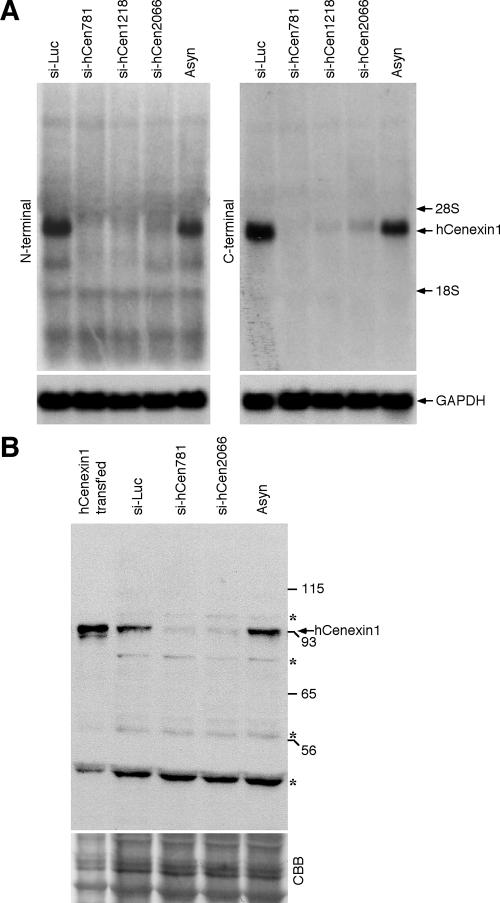
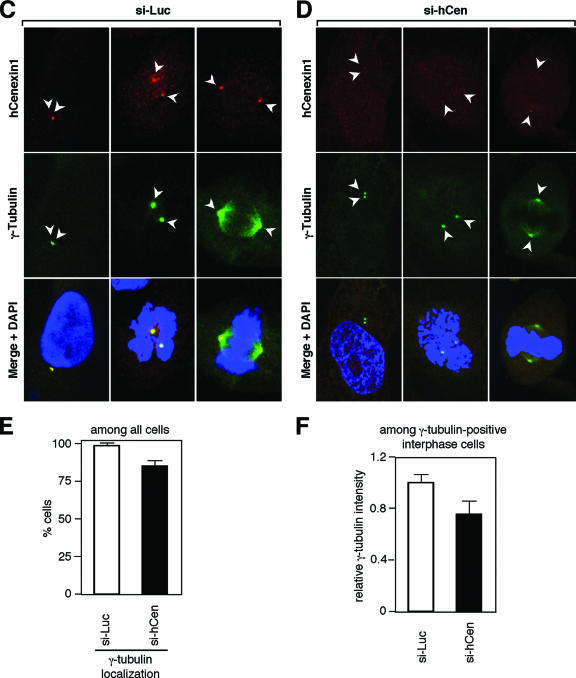
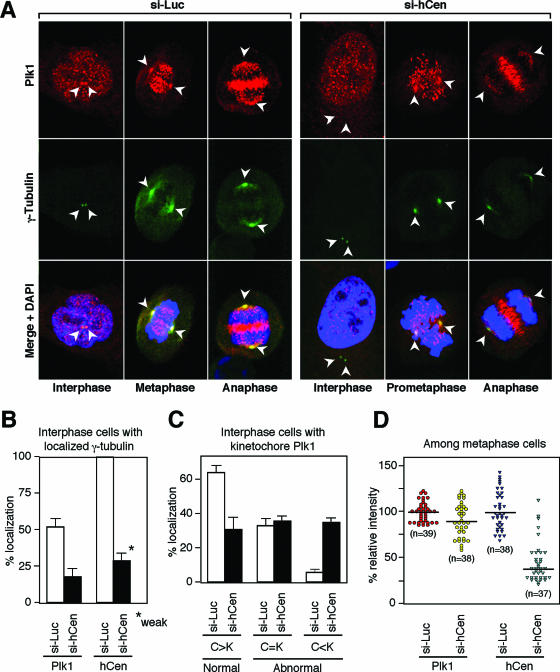
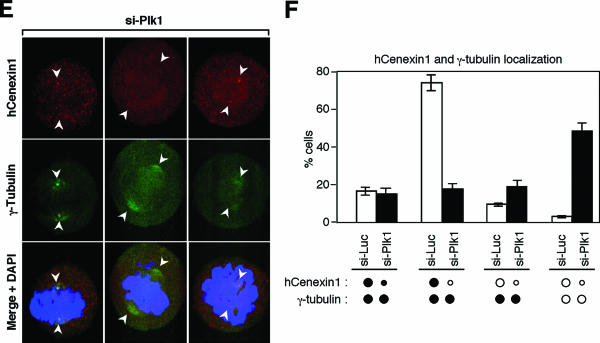
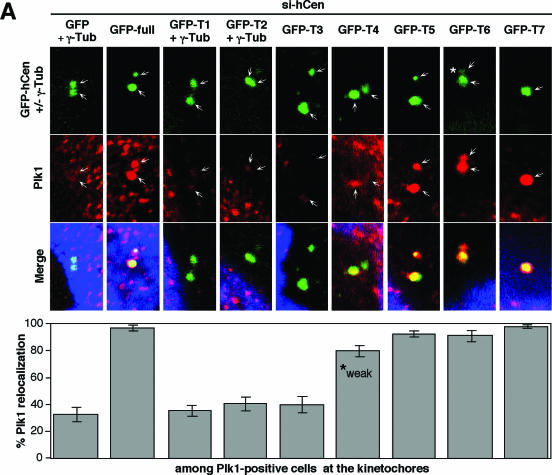
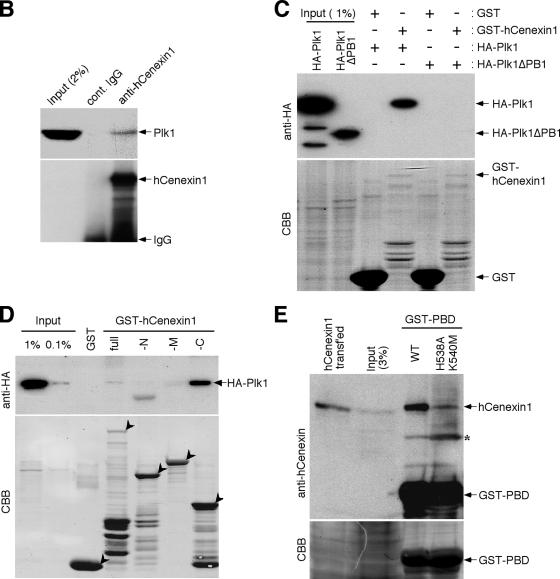
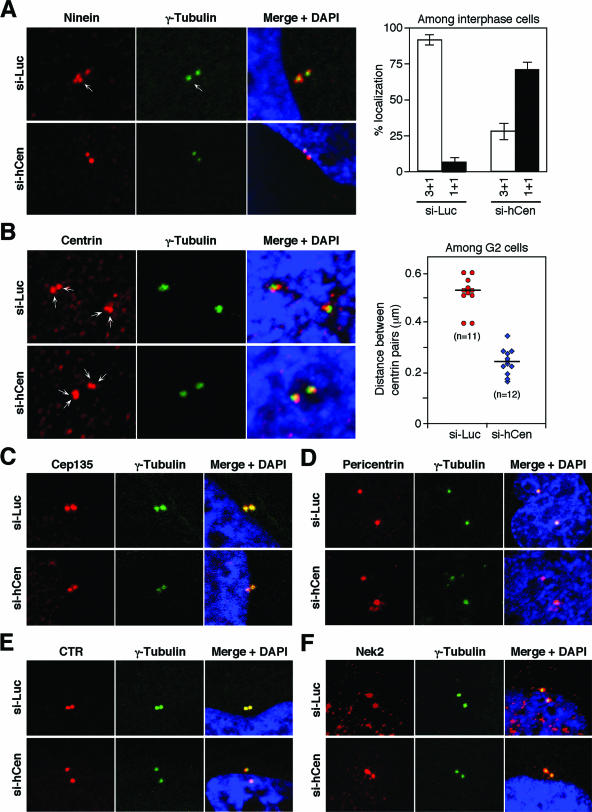
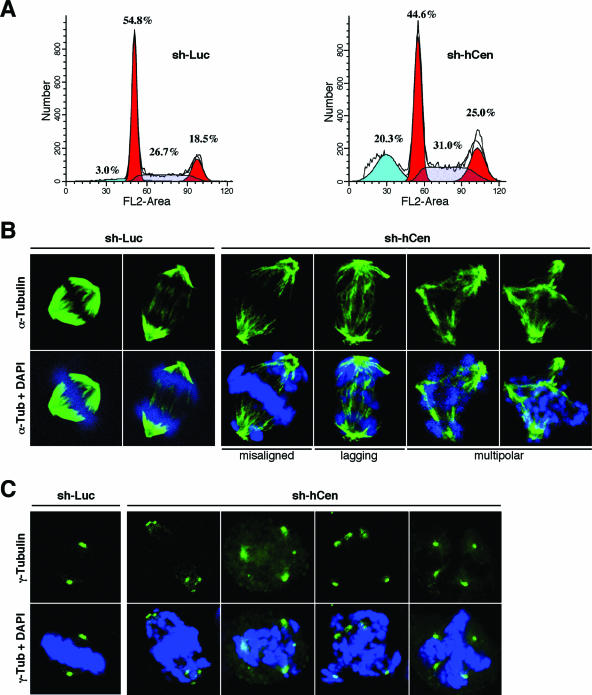
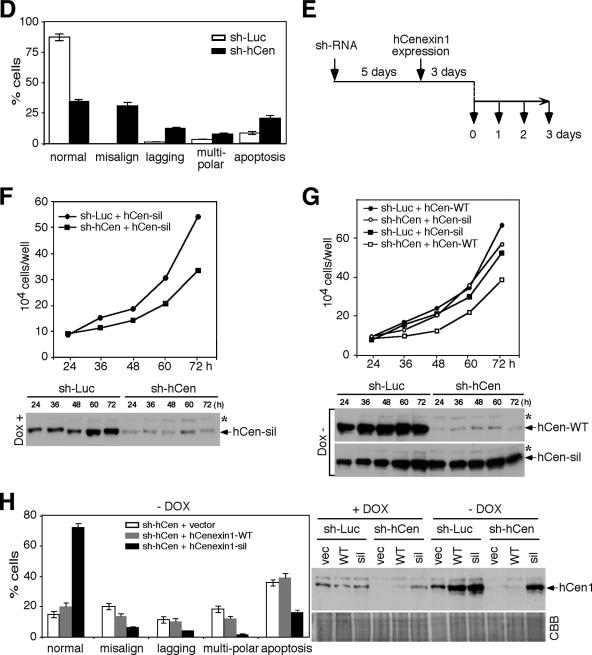
Outer dense fiber 2 (Odf2) was initially identified as a major component of sperm tail cytoskeleton and later was suggested to be a widespread component of centrosomal scaffold that preferentially associates with the appendages of the mother centrioles in somatic cells. Here we report the identification of two Odf2-related centrosomal components, hCenexin1 and hCenexin1 variant 1, that possess a unique C-terminal extension. Our results showed that hCenexin1 is the major isoform expressed in HeLa cells, whereas hOdf2 is not detectably expressed. Mammalian polo-like kinase 1 (Plk1) is critical for proper mitotic progression, and its association with the centrosome is important for microtubule nucleation and function. Interestingly, depletion of hCenexin1 by RNA interference (RNAi) delocalized Plk1 from the centrosomes and the C-terminal extension of hCenexin1 was crucial to recruit Plk1 to the centrosomes through a direct interaction with the polo-box domain of Plk1. Consistent with these findings, the hCenexin1 RNAi cells exhibited weakened gamma-tubulin localization and chromosome segregation defects. We propose that hCenexin1 is a critical centrosomal component whose C-terminal extension is required for proper recruitment of Plk1 and other components crucial for normal mitosis. Our results further suggest that the anti-Odf2 immunoreactive centrosomal antigen previously detected in non-germ line cells is likely hCenexin1.


Figures

FIG. 1.
FIG. 1.
(A) Schematic comparison of primary amino acid sequences between hCenexin1 and its related proteins. hCenexin1 (accession no. DQ444714), hCenexin1 variant 1 (var. 1) (accession no. DQ444713), rCenexin2 (accession no. AF162756), and hOdf2 (accession no. AF012549) are shown. Percentages in parentheses indicate percent identity between hCenexin1 and the respective proteins at the amino acid level. Black boxes denote the 19-aa insertions found in hCenexin1 variant 1 and rCenexin2, whereas gray boxes indicate two putative leucine zipper motifs. Dotted boxes in the C-terminal extension are found only in the Cenexin subfamily and exhibit 85% identity. (B) Sequence alignment between hCenexin1 and its related sequences in the N-terminal insertion region. Gray boxes indicate the identical sequences among all four sequences, whereas the outlined boxes indicate the identical sequences within the 19-amino-acid insertion. (C) Schematic diagram of chromosome 9q34.11 region (from nucleotide 130258253 to nucleotide 130303060) (adapted from NCBI database). Vertical bars with numbers indicate exons for hCenexin1, hCenexin1 variant 1, and hOdf2. Note that the exon 2 for hCenexin1 variant 1 (*) is thicker than the corresponding exon for hCenexin1 because of the 19-aa insertion.
FIG. 2.
FIG. 2.
hCenexin1 is the major Odf2-related isoform abundantly expressed at the late stages of the cell cycle. (A) An anti-hCenexin antibody detects a 95-kDa protein from asynchronously growing HeLa cells (Asyn). For comparison, lysates from HeLa cells transfected with either the full-length hCENEXIN1 or the full-length hCENEXIN1 variant 1 (var. 1) were also separated after being diluted ∼20-fold (as a result, the endogenous 95-kDa protein was not detected). Asterisks indicate nonspecific proteins cross-reacting with anti-hCenexin antibody. Numbers at left are molecular masses in kilodaltons. (B and C) HeLa cells were arrested at the G1/S boundary by double thymidine block and then released into fresh medium. Samples harvested at the indicated time points were subjected to flow cytometry analysis (B) and immunoblotting analyses with the indicated antibodies (C). The same membrane was stained with CBB for loading controls. Asterisk, nonspecific cross-reacting protein. The levels of hCenexin1 and cyclin B1 were quantified using the Image J program (graph). (D) To synchronize the HeLa cells at specific stages of the cell cycle, cells were treated with either mimosine (G1), thymidine (S), etoposide (G2), or nocodazole (M) as described in Materials and Methods. Total RNAs were prepared for Northern blot analyses using the PCR fragments bearing either the N-terminal region (aa 120 to 253 of hCenexin1) (left panel) or the C-terminal extension region (aa 652 to 784 of hCenexin1) (right panel) as a probe. The same membrane was used to detect glyceraldehyde-3-phosphate dehydrogenase (GAPDH) as a loading control.
FIG. 3.
FIG. 3.
hCenexin1 preferentially localizes to one of the two centrosomes. (A and B) Asynchronously growing HeLa cells were subjected to coimmunostaining analyses with anti-hCenexin and anti-α-tubulin antibodies (A) or anti-hCenexin and anti-γ-tubulin antibodies (B). Arrows (G1) and arrowheads (S/G2) indicate centrosomes. (C) The percentages of cells with unequal hCenexin1 signals (estimated by eye) were determined by comparing hCenexin1 signals with two γ-tubulin signals within the same cells. More than 150 cells were counted in each of three independent experiments. Error bars indicate standard deviations. (D) Indicated cultured cells were immunostained with anti-hCenexin and anti-γ-tubulin antibodies. Among interphase centrosomes, the percentages of unequal hCenexin1 signals were determined as in panel C. More than 200 cells were counted for each cell line.
FIG.4.
FIG.4.
Complexity of hCenexin1 localization to the mother centrioles. (A) HeLa cells transfected with GFP-fused hCENEXIN1 were fixed and stained with anti-Cep135 antibody to determine the ability of hCenexin1 to localize to the centrosomes (arrowheads). (B and C) Various truncated forms of hCenexin1 depicted in panel B were transfected into HeLa cells to determine the ability of each construct to localize to the centrosomes (arrows) (C). Typical localization patterns of each construct are depicted as one or two dots (right). Big dots indicate strong signals for localization to the mother centrioles, whereas small dots indicate weak signals for localization to the daughter centrioles. Gray dots depict inefficient and weak localization. a, the GFP-T6 and GFP-T7 constructs frequently exhibited a very weak daughter centriole localization (see text). (D) Cells expressing GFP-T3, GFP-T7, or the full-length GFP-hCenexin1 were stained with anti-γ-tubulin antibody to determine their patterns of localization to the centrosomes. Only the interphase cells with two distinct γ-tubulin signals were subjected to counting. Black dots, localized signals; open dots, no localized signals. Approximately 250 cells were counted in each of two independent experiments. Error bars indicate standard deviations. (E) HeLa cells transfected with either the full-length GFP-hCenexin1 or the GFP-T7 were subjected to immunostaining with antininein antibody. Inset, a high magnification of the mother centriole area.
FIG.4.
FIG.4.
Complexity of hCenexin1 localization to the mother centrioles. (A) HeLa cells transfected with GFP-fused hCENEXIN1 were fixed and stained with anti-Cep135 antibody to determine the ability of hCenexin1 to localize to the centrosomes (arrowheads). (B and C) Various truncated forms of hCenexin1 depicted in panel B were transfected into HeLa cells to determine the ability of each construct to localize to the centrosomes (arrows) (C). Typical localization patterns of each construct are depicted as one or two dots (right). Big dots indicate strong signals for localization to the mother centrioles, whereas small dots indicate weak signals for localization to the daughter centrioles. Gray dots depict inefficient and weak localization. a, the GFP-T6 and GFP-T7 constructs frequently exhibited a very weak daughter centriole localization (see text). (D) Cells expressing GFP-T3, GFP-T7, or the full-length GFP-hCenexin1 were stained with anti-γ-tubulin antibody to determine their patterns of localization to the centrosomes. Only the interphase cells with two distinct γ-tubulin signals were subjected to counting. Black dots, localized signals; open dots, no localized signals. Approximately 250 cells were counted in each of two independent experiments. Error bars indicate standard deviations. (E) HeLa cells transfected with either the full-length GFP-hCenexin1 or the GFP-T7 were subjected to immunostaining with antininein antibody. Inset, a high magnification of the mother centriole area.
FIG.5.
FIG.5.
hCenexin1 is the major Odf2-related isoform expressed in HeLa cells. (A) Cells were transfected with either control luciferase siRNA (si-Luc) or the indicated siRNAs against hCenexin1. Total RNAs prepared from the cells 3 days after transfection were subjected to Northern blot analyses using either N-terminal (aa 120 to 253 of hCenexin1) or C-terminal (aa 652 to 784 of hCenexin1) probes. Glyceraldehyde-3-phosphate dehydrogenase (GAPDH) signals serve as loading controls for each lane. (B) Total lysates were prepared from HeLa cells transfected with the indicated siRNAs for 3 days and then subjected to immunoblotting analyses with anti-hCenexin antibody. Asynchronous cells (Asyn) and cells transfected with the full-length hCENEXIN1 were also loaded for comparison. Asterisks indicate proteins cross-reacting with the hCenexin1 antibody that were insensitive to si-hCen. CBB, CBB staining of the same membrane. Numbers at right are molecular masses in kilodaltons. (C to F) HeLa cells transfected with either si-Luc (C) or si-hCen781 (si-hCen) (D) were stained with anti-hCenexin and anti-γ-tubulin antibodies. Arrowheads mark the position of centrosomes. (E) These cells were then counted to determine the efficiency of γ-tubulin localization to the centrosomes. Approximately 250 cells were counted in each of two independent experiments. Error bars show standard deviations. (F) The intensities of γ-tubulin fluorescence for each sample were measured from more than 50 interphase cells with separated γ-tubulin signals chosen at random. Images were acquired with the same settings and then analyzed using Zeiss LSM 510 software. The level for the si-Luc cells was normalized to 1. Error bars indicate standard deviations.
FIG.5.
FIG.5.
hCenexin1 is the major Odf2-related isoform expressed in HeLa cells. (A) Cells were transfected with either control luciferase siRNA (si-Luc) or the indicated siRNAs against hCenexin1. Total RNAs prepared from the cells 3 days after transfection were subjected to Northern blot analyses using either N-terminal (aa 120 to 253 of hCenexin1) or C-terminal (aa 652 to 784 of hCenexin1) probes. Glyceraldehyde-3-phosphate dehydrogenase (GAPDH) signals serve as loading controls for each lane. (B) Total lysates were prepared from HeLa cells transfected with the indicated siRNAs for 3 days and then subjected to immunoblotting analyses with anti-hCenexin antibody. Asynchronous cells (Asyn) and cells transfected with the full-length hCENEXIN1 were also loaded for comparison. Asterisks indicate proteins cross-reacting with the hCenexin1 antibody that were insensitive to si-hCen. CBB, CBB staining of the same membrane. Numbers at right are molecular masses in kilodaltons. (C to F) HeLa cells transfected with either si-Luc (C) or si-hCen781 (si-hCen) (D) were stained with anti-hCenexin and anti-γ-tubulin antibodies. Arrowheads mark the position of centrosomes. (E) These cells were then counted to determine the efficiency of γ-tubulin localization to the centrosomes. Approximately 250 cells were counted in each of two independent experiments. Error bars show standard deviations. (F) The intensities of γ-tubulin fluorescence for each sample were measured from more than 50 interphase cells with separated γ-tubulin signals chosen at random. Images were acquired with the same settings and then analyzed using Zeiss LSM 510 software. The level for the si-Luc cells was normalized to 1. Error bars indicate standard deviations.
FIG.6.
FIG.6.
Mutual requirement of hCenexin1 and Plk1 for proper localization to the centrosomes. (A) HeLa cells transfected with either control si-Luc or si-hCen781 (si-hCen) were subjected to immunostaining analyses with anti-Plk1 and anti-γ-tubulin antibodies. The γ-tubulin signals (arrowheads) serve as markers for centrosomes. (B) Quantitation of cells with the centrosomal Plk1 or the hCenexin1 signals was carried out using the samples costained with anti-γ-tubulin antibody. Since Plk1 signals are not readily detectable in early stages of the cell cycle, only G2 cells (Plk1 localizes to the centrosomes and kinetochores at this stage) with two distinct γ-tubulin signals were counted. Transfection of si-hCen greatly diminished, but did not eliminate, hCenexin1 signals (marked “weak”) at the centrosomes. More than 300 cells were counted in each of three independent experiments. Error bars show standard deviations. (C) Among the G2 cells with detectable Plk1 signals at the kinetochores (>300 cells), relative Plk1 signal intensities between the centrosomes and the kinetochores were visually compared and then scored in two independent experiments. C>K indicates that the centrosomal Plk1 signals are greater than the kinetochore Plk1 signals, whereas C<K indicates that the Plk1 signals from the kinetochores are greater than those from the centrosomes. (D) To quantify the level of Plk1 and hCenexin1 signal intensities among metaphase cells, acquired images (“n” indicates the number of cells) were analyzed using Zeiss confocal software and then plotted as described in Materials and Methods. The black horizontal lines indicate the average intensities in each group. (E) To determine whether Plk1 depletion influences the localization of hCenexin1 to the centrosomes, HeLa cells transfected with si-Plk1 were costained with anti-hCenexin and anti-γ-tubulin antibodies. Arrowheads indicate the positions of centrosomes. (F) Approximately 250 cells were counted in two independent experiments to determine the patterns of hCenexin1 and γ-tubulin localization. Error bars indicate standard deviations.
FIG.6.
FIG.6.
Mutual requirement of hCenexin1 and Plk1 for proper localization to the centrosomes. (A) HeLa cells transfected with either control si-Luc or si-hCen781 (si-hCen) were subjected to immunostaining analyses with anti-Plk1 and anti-γ-tubulin antibodies. The γ-tubulin signals (arrowheads) serve as markers for centrosomes. (B) Quantitation of cells with the centrosomal Plk1 or the hCenexin1 signals was carried out using the samples costained with anti-γ-tubulin antibody. Since Plk1 signals are not readily detectable in early stages of the cell cycle, only G2 cells (Plk1 localizes to the centrosomes and kinetochores at this stage) with two distinct γ-tubulin signals were counted. Transfection of si-hCen greatly diminished, but did not eliminate, hCenexin1 signals (marked “weak”) at the centrosomes. More than 300 cells were counted in each of three independent experiments. Error bars show standard deviations. (C) Among the G2 cells with detectable Plk1 signals at the kinetochores (>300 cells), relative Plk1 signal intensities between the centrosomes and the kinetochores were visually compared and then scored in two independent experiments. C>K indicates that the centrosomal Plk1 signals are greater than the kinetochore Plk1 signals, whereas C<K indicates that the Plk1 signals from the kinetochores are greater than those from the centrosomes. (D) To quantify the level of Plk1 and hCenexin1 signal intensities among metaphase cells, acquired images (“n” indicates the number of cells) were analyzed using Zeiss confocal software and then plotted as described in Materials and Methods. The black horizontal lines indicate the average intensities in each group. (E) To determine whether Plk1 depletion influences the localization of hCenexin1 to the centrosomes, HeLa cells transfected with si-Plk1 were costained with anti-hCenexin and anti-γ-tubulin antibodies. Arrowheads indicate the positions of centrosomes. (F) Approximately 250 cells were counted in two independent experiments to determine the patterns of hCenexin1 and γ-tubulin localization. Error bars indicate standard deviations.
FIG.7.
FIG.7.
hCenexin1 promotes Plk1 localization to the centrosomes through the interaction between the C-terminal extension of hCenexin1 and the PBD of Plk1. (A) To examine the ability of hCenexin1 to relocalize Plk1 to the centrosomes, HeLa cells were first depleted of hCenexin1 and then infected with adenoviruses expressing either the full length or various truncations of GFP-hCenexin1 before being subjected to immunostaining analyses with anti-Plk1 antibody. Cells expressing GFP vector, GFP-T1, or GFP-T2 were costained with γ-tubulin antibody to mark the positions of centrosomes. The full-length GFP-hCenexin1 and GFP-T3-GFP-T7 constructs efficiently localized to the centrosomes by themselves. GFP-T4 was able to recruit Plk1 to the centrosomes, but the recruited Plk1 signals (marked “weak”) were significantly lower than those of Plk1 recruited by GFP-T5, GFP-T6, or GFP-T7. A nascent GFP-T6 signal (*) localized at the daughter centriole appeared to be sufficient to recruit Plk1 to that site. Arrows indicate centrosomes. Approximately 120 cells were counted in each of two independent experiments. Error bars indicate standard deviations. (B) Total cellular lysates prepared from nocodazole-arrested HeLa cells were subjected to immunoprecipitation with either control rabbit immunoglobulin G (IgG) or anti-hCenexin antibody. Coprecipitated Plk1 was detected with a mouse anti-Plk1 antibody. (C and D) To carry out in vitro binding analyses, the indicated bead-bound GST or GST-fused ligands (0.5 to 3 μg; see the CBB stain) were incubated with Sf9 cell lysates (1 mg) expressing either HA-Plk1 or HA-Plk1ΔPB1 (C) or HA-Plk1 (D). After pull-down, proteins were separated by 10% SDS-PAGE and then subjected to immunoblotting analyses. Afterwards, the same membranes were stained with CBB to visualize the ligand proteins. Arrowheads indicate ligands used for each binding. (E) Mitotic HeLa lysates (2 mg) were incubated with bead-bound GST-PBD or the corresponding GST-PBD(H538A, K540M) mutant (6 μg each), and the resulting precipitates were immunoblotted with anti-hCenexin antibody (top panel) followed by CBB staining (bottom panel). Because anti-hCenexin antibody was generated using GST-hCenexin1 fragment as an immunogen, it also detected the GST-PBD ligand. The asterisk indicates a cross-reacting band.
FIG.7.
FIG.7.
hCenexin1 promotes Plk1 localization to the centrosomes through the interaction between the C-terminal extension of hCenexin1 and the PBD of Plk1. (A) To examine the ability of hCenexin1 to relocalize Plk1 to the centrosomes, HeLa cells were first depleted of hCenexin1 and then infected with adenoviruses expressing either the full length or various truncations of GFP-hCenexin1 before being subjected to immunostaining analyses with anti-Plk1 antibody. Cells expressing GFP vector, GFP-T1, or GFP-T2 were costained with γ-tubulin antibody to mark the positions of centrosomes. The full-length GFP-hCenexin1 and GFP-T3-GFP-T7 constructs efficiently localized to the centrosomes by themselves. GFP-T4 was able to recruit Plk1 to the centrosomes, but the recruited Plk1 signals (marked “weak”) were significantly lower than those of Plk1 recruited by GFP-T5, GFP-T6, or GFP-T7. A nascent GFP-T6 signal (*) localized at the daughter centriole appeared to be sufficient to recruit Plk1 to that site. Arrows indicate centrosomes. Approximately 120 cells were counted in each of two independent experiments. Error bars indicate standard deviations. (B) Total cellular lysates prepared from nocodazole-arrested HeLa cells were subjected to immunoprecipitation with either control rabbit immunoglobulin G (IgG) or anti-hCenexin antibody. Coprecipitated Plk1 was detected with a mouse anti-Plk1 antibody. (C and D) To carry out in vitro binding analyses, the indicated bead-bound GST or GST-fused ligands (0.5 to 3 μg; see the CBB stain) were incubated with Sf9 cell lysates (1 mg) expressing either HA-Plk1 or HA-Plk1ΔPB1 (C) or HA-Plk1 (D). After pull-down, proteins were separated by 10% SDS-PAGE and then subjected to immunoblotting analyses. Afterwards, the same membranes were stained with CBB to visualize the ligand proteins. Arrowheads indicate ligands used for each binding. (E) Mitotic HeLa lysates (2 mg) were incubated with bead-bound GST-PBD or the corresponding GST-PBD(H538A, K540M) mutant (6 μg each), and the resulting precipitates were immunoblotted with anti-hCenexin antibody (top panel) followed by CBB staining (bottom panel). Because anti-hCenexin antibody was generated using GST-hCenexin1 fragment as an immunogen, it also detected the GST-PBD ligand. The asterisk indicates a cross-reacting band.
FIG. 8.
FIG. 8.
Knockdown of hCenexin disrupts proper localization of ninein and centrin. HeLa cells transfected with either control si-Luc or si-hCen781 (si-hCen) for 3 days were subjected to immunostainings with the indicated antibodies. (A) Knockdown of hCenexin1 drastically altered the localization patterns of ninein. More than 200 cells were counted in each of two independent experiments. Error bars indicate standard deviations. (B) Knockdown of hCenexin1 diminishes the intercentriolar distance between the centrin pairs. Confocal images were acquired and analyzed as described in Materials and Methods. The resulting data points were plotted using the Sigma Plot 9 program. “n” denotes the number of cells analyzed. (C to F) Under the same conditions, the localization of Cep135 (C) was mildly weakened (see text), whereas localizations of pericentrin (D), CTR (E), and Nek2 (F) were largely unchanged.
FIG.9.
FIG.9.
Depletion of hCenexin results in chromosome segregation failures and apoptosis. (A) HeLa cells were infected with lentiviruses expressing either control sh-luciferase (sh-Luc) or sh-hCen781 (sh-hCen) and then selected with puromycin for 5 days. Cells were harvested 6 days after infection for flow cytometry analyses. The obtained data were analyzed by using the ModFit program. (B to D) The same samples obtained in panel A were subjected to immunostaining analyses with anti-α-tubulin antibody (B) or anti-γ-tubulin antibody (C), and the defects in chromosome segregation were quantified (>250 cells) in each of three independent experiments (D). (E to G) HeLa cells were infected with lentiviruses expressing either control sh-Luc or sh-hCen. After the cells were selected for 5 days, they were additionally infected with lentiviruses expressing either hCenexin1-WT or the hCenexin1-sil mutant insensitive to sh-hCen. Samples were harvested as shown in panel E. Growth rates of either sh-Luc cells or sh-hCen cells were determined in the absence (Dox+) (F) or presence (Dox−) (G) of hCenexin1 expression. To determine the level of hCenexin1 expression, indicated samples were subjected to immunoblotting analyses with anti-hCenexin antibody. Asterisks indicate a nonspecific protein cross-reacting with anti-hCenexin antibody. (H) HeLa cells preparedas in panel E were subjected to immunostaining analyses to determine whether expression of hCenexin-sil complements the mitotic defect associated with the depletion of hCenexin1. Cells transfected with an hCenexin1-sil construct (last lane; hCen-sil transf'ed) were loaded to mark the position of hCenexin1 migrating in the gel. More than 250 cells were counted in each of three independent experiments. Error bars indicate standard deviations.
FIG.9.
FIG.9.
Depletion of hCenexin results in chromosome segregation failures and apoptosis. (A) HeLa cells were infected with lentiviruses expressing either control sh-luciferase (sh-Luc) or sh-hCen781 (sh-hCen) and then selected with puromycin for 5 days. Cells were harvested 6 days after infection for flow cytometry analyses. The obtained data were analyzed by using the ModFit program. (B to D) The same samples obtained in panel A were subjected to immunostaining analyses with anti-α-tubulin antibody (B) or anti-γ-tubulin antibody (C), and the defects in chromosome segregation were quantified (>250 cells) in each of three independent experiments (D). (E to G) HeLa cells were infected with lentiviruses expressing either control sh-Luc or sh-hCen. After the cells were selected for 5 days, they were additionally infected with lentiviruses expressing either hCenexin1-WT or the hCenexin1-sil mutant insensitive to sh-hCen. Samples were harvested as shown in panel E. Growth rates of either sh-Luc cells or sh-hCen cells were determined in the absence (Dox+) (F) or presence (Dox−) (G) of hCenexin1 expression. To determine the level of hCenexin1 expression, indicated samples were subjected to immunoblotting analyses with anti-hCenexin antibody. Asterisks indicate a nonspecific protein cross-reacting with anti-hCenexin antibody. (H) HeLa cells preparedas in panel E were subjected to immunostaining analyses to determine whether expression of hCenexin-sil complements the mitotic defect associated with the depletion of hCenexin1. Cells transfected with an hCenexin1-sil construct (last lane; hCen-sil transf'ed) were loaded to mark the position of hCenexin1 migrating in the gel. More than 250 cells were counted in each of three independent experiments. Error bars indicate standard deviations.

References

    1. Arnaud, L., J. Pines, and E. A. Nigg. 1998. GFP tagging reveals human Polo-like kinase 1 at the kinetochore/centromere region of mitotic chromosomes. Chromosoma 107:424-429. - PubMed
    1. Barr, F. A., H. H. Sillje, and E. A. Nigg. 2004. Polo-like kinases and the orchestration of cell division. Nat. Rev. Mol. Cell Biol. 5:429-440. - PubMed
    1. Beausoleil, S. A., M. Jedrychowski, D. Schwartz, J. E. Elias, J. Villen, J. Li, M. A. Cohn, L. C. Cantley, and S. P. Gygi. 2004. Large-scale characterization of HeLa cell nuclear phosphoproteins. Proc. Natl. Acad. Sci. USA 101:12130-12135. - PMC - PubMed
    1. Brohmann, H., S. Pinnecke, and S. Hoyer-Fender. 1997. Identification and characterization of new cDNAs encoding outer dense fiber proteins of rat sperm. J. Biol. Chem. 272:10327-10332. - PubMed
    1. Casenghi, M., P. Meraldi, U. Weinhart, P. I. Duncan, R. Korner, and E. A. Nigg. 2003. Polo-like kinase 1 regulates Nlp, a centrosome protein involved in microtubule nucleation. Dev. Cell 5:113-125. - PubMed

Publication types

MeSH terms

LinkOut - more resources