. 2006 Nov;74(11):6252-63.
doi: 10.1128/IAI.00847-06. Epub 2006 Sep 11.

Aberrant contraction of antigen-specific CD4 T cells after infection in the absence of gamma interferon or its receptor

Affiliations

Aberrant contraction of antigen-specific CD4 T cells after infection in the absence of gamma interferon or its receptor

Jodie S Haring et al. Infect Immun. 2006 Nov.

Abstract

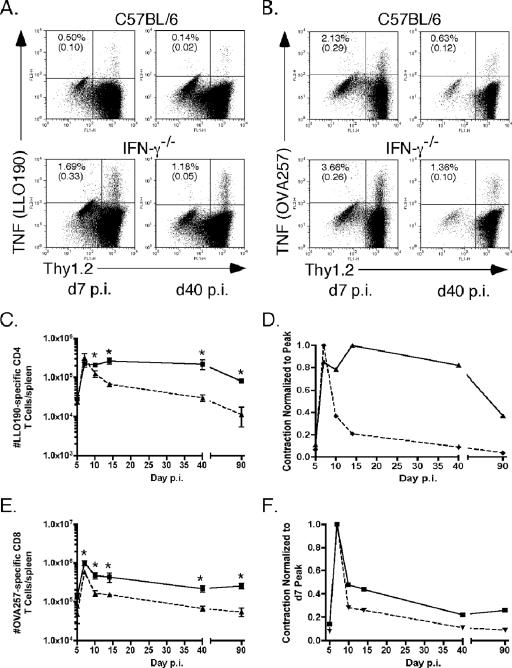
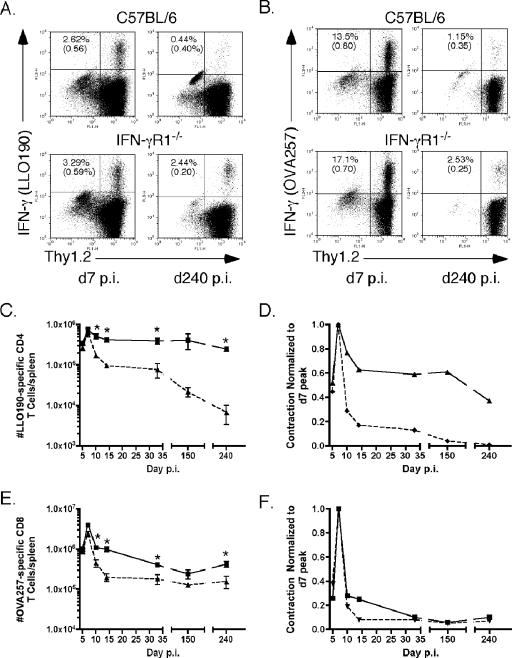
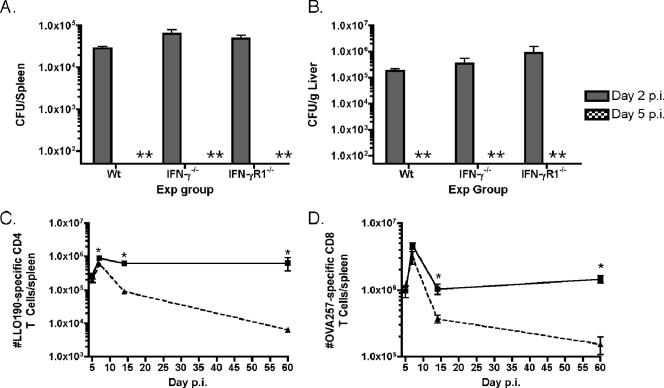
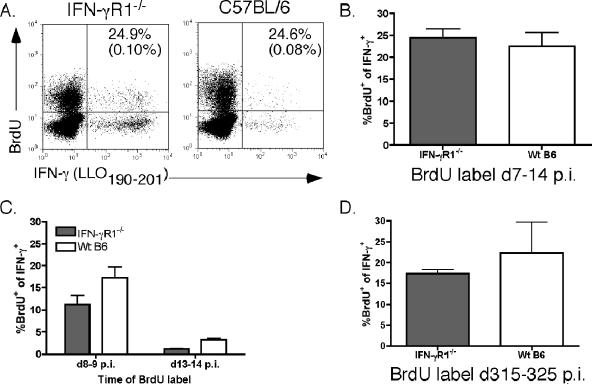
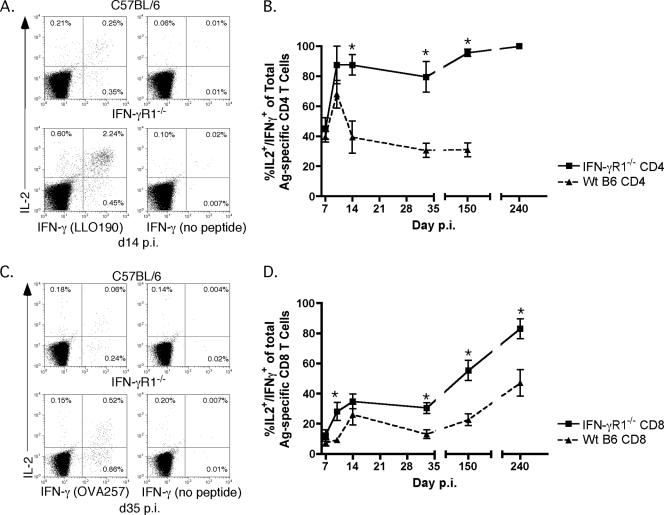
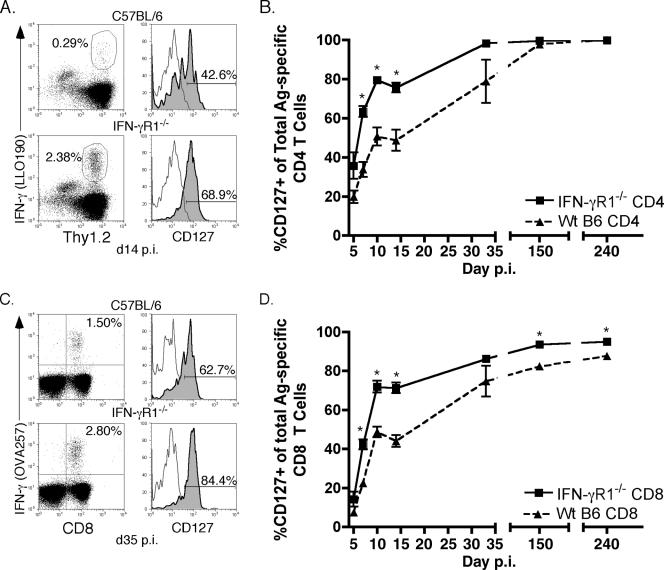
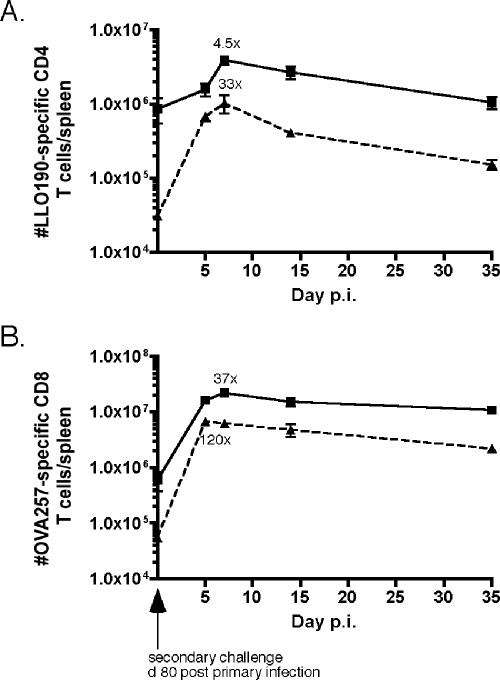
Several lines of evidence from different model systems suggest that gamma interferon (IFN-gamma) is an important regulator of T-cell contraction after antigen (Ag)-driven expansion. To specifically investigate the role of IFN-gamma in regulating the contraction of Ag-specific CD4 T cells, we infected IFN-gamma-/- and IFN-gammaR1-/- mice with attenuated Listeria monocytogenes and monitored the numbers of Ag-specific CD4 T cells during the expansion, contraction, and memory phases of the immune response to infection. In the absence of IFN-gamma or the ligand-binding portion of its receptor, Ag-specific CD4 T cells exhibited normal expansion in numbers, but in both strains of deficient mice there was very little decrease in the number of Ag-specific CD4 T cells even at time points later than day 90 after infection. This significant delay in contraction was not due to prolonged infection, since mice treated with antibiotics to conclusively eliminate infection exhibited the same defect in contraction. In addition to altering the number of Ag-specific CD4 T cells, the absence of IFN-gamma signaling also changed the phenotype of cells generated after infection. IFN-gammaR1-/- Ag-specific CD4 T cells reacquired expression of CD127 more quickly than wild-type cells, and more IFN-gammaR1-/- CD4 T cells were capable of producing both IFN-gamma and interleukin 2 following Ag stimulation. From these data we conclude that IFN-gamma regulates the contraction, phenotype, and function of Ag-specific CD4 T cells generated after infection.


Figures

FIG. 1.
FIG. 1.
IFN-γ regulates Ag-specific CD4 T-cell responses. The numbers of Ag-specific CD4 and CD8 T cells in IFN-γ−/− and wt B6 mice were monitored at various times following infection using intracellular cytokine staining for TNF after peptide stimulation. (A) ICS of CD4 T cells from wt (top) or IFN-γ−/− (bottom) mice on day 7 (d7) (left) or day 40 (d40) (right) p.i. after stimulation with LLO190-201. Plots were first gated on CD4+ cells. Top numbers in each plot are the percentage of CD4+ Thy1.2+ cells TNF positive after peptide stimulation. Numbers in parentheses are the percent TNF+ cells with no peptide stimulation. (B) ICS of CD8 T cells from wt (top) or IFN-γ−/− (bottom) mice day 7 (left) or day 40 (right) p.i. after stimulation with OVA257-264. Plots were first gated on CD8+ cells. Top numbers are the percentage of CD8+ Thy1.2+ cells TNF positive after peptide stimulation. Numbers in parentheses are the percent TNF+ cells with no peptide stimulation. (C) Total numbers of LLO190-201-specific CD4 T cells per spleen at the days p.i. indicated on the x axis calculated as described in Materials and Methods. Squares are the numbers of cells for IFN-γ−/− mice. Triangles are the numbers of cells for wt B6 mice. The number of mice per group per time point was three to six. *, P value of <0.05 as determined using the Student t test. (D) Kinetics of the LLO190-201-specific CD4 T-cell response normalized to the peak of T-cell numbers, which was on day 7 p.i. for wt B6 mice and on day 14 p.i. for IFN-γ−/− mice. (E) Total numbers of OVA257-264-specific CD8 T cells per spleen at the days p.i. indicated on the x axis. Squares are the numbers of cells for IFN-γ−/− mice. Triangles are the numbers of cells for wt B6 mice. The number of mice per group per time point was three to six. *, P value of <0.05 as determined using the Student t test. (F) Kinetics of the OVA257-264-specific CD8 T-cell response normalized to the peak of T-cell numbers, which was on day 7 p.i. for both types of mice.
FIG. 2.
FIG. 2.
Absence of IFN-γ signaling results in aberrant contraction of Ag-specific CD4 T cells. The numbers of Ag-specific T cells in IFN-γR1−/− and wt B6 mice were monitored at various times after infection using intracellular cytokine staining for IFN-γ. (A) ICS of cells from wt (top) or IFN-γR1−/− (bottom) mice on day 7 (d7) (left) or day 240 (d240) (right) p.i. after stimulation with LLO190-201. Plots were first gated on CD4+ cells. Top numbers are the percentage of CD4+ Thy1.2+ cells that are IFN-γ positive after peptide stimulation. Numbers in parentheses are the percent IFN-γ+ cells with no peptide stimulation. (B) ICS of cells from wt (top) or IFN-γR1−/− (bottom) mice on day 7 (left) and day 240 (right) p.i. after stimulation with OVA257-264. Plots were first gated on CD8+ cells. Top numbers are the percentage of CD8+ Thy1.2+ cells that are IFN-γ positive after peptide stimulation. Numbers in parentheses are the percent IFN-γ+ cells with no peptide stimulation. (C) Total numbers of LLO190-201-specific CD4 T cells per spleen at the days p.i. indicated on the x axis, calculated as described in Materials and Methods. Squares are the numbers of cells for IFN-γR1−/− mice. Triangles are the numbers of cells for wt B6 mice. The number of mice per group per time point was three to nine. *, P value of <0.05 as determined using the Student t test. (D) Kinetics of the LLO190-201-specific CD4 T-cell response normalized to the peak of T-cell numbers, which was on day 7 p.i. for both types of mice. (E) Total numbers of OVA257-264-specific CD8 T cells per spleen at the days p.i. indicated on the x axis. Squares are the numbers of cells for IFN-γR1−/− mice. Triangles are the numbers of cells for wt B6 mice. The number of mice per group per time point was three to nine. *, P value of <0.05 as determined using the Student t test. (F) Kinetics of the OVA257-264-specific CD8 T-cell response normalized to the peak of T-cell numbers, which was on day 7 p.i. for both types of mice.
FIG. 3.
FIG. 3.
Infection in IFN-γ and IFN-γR1 mice is not significantly prolonged compared to infection in wt B6 mice. (A and B) Numbers of bacteria in the spleens (A) or livers (B) of wt B6 (Wt), IFN-γ−/−, or IFN-γR1−/− mice on day 2 (shaded columns) or 5 (hatched columns) p.i. A double asterisk indicates none detected. The limit of detection of the assay was 50 CFU/organ. Exp group, experimental group. (C) Numbers of LLO190-201-specific CD4 T cells in ampicillin-treated IFN-γR1−/− mice (squares) or wt B6 mice (triangles) were determined using ICS for IFN-γ on the days after infection indicated on the x axis. The number of mice per group per time point was three. *, P value of <0.05 as determined using the Student t test. (D) Numbers of OVA257-264-specific CD8 T cells in ampicillin-treated mice. The number of mice per group per time point was three. *, P value of <0.05 as determined using the Student t test.
FIG. 4.
FIG. 4.
Ag-specific CD4 T cells do not exhibit increased proliferation or decreased apoptosis compared to wt T cells. (A) Intracellular staining of cells from IFN-γR1−/− (left) or wt B6 (right) mice for intracellular IFN-γ and incorporated BrdU or control immunoglobulin. Dot plots are of splenocytes gated on CD4+ Thy1.2+ cells. Numbers are the frequency of IFN-γ+ cells that were also BrdU+. Numbers in parentheses are frequencies of IFN-γ+ cells that stained positive with an isotype control for the BrdU antibody. (B) Average frequency of IFN-γ+ BrdU+ CD4 T cells found in each group of mice after labeling from day 7 to day 14 (d7-14) p.i. There were three mice in each group. (C) Average frequency of IFN-γ+ BrdU+ CD4 T cells detected after short-term (24 h) BrdU labeling from day 8 to day 9 (d8-9) p.i. or day 13 to day 14 (d13-14) p.i. There were three mice per group. (D) Average frequency of IFN-γ+ BrdU+ memory CD4 T cells detected after labeling with BrdU from day 315 to day 325 (d315-325) p.i. There were three mice per group.
FIG. 5.
FIG. 5.
Capacity of Ag-specific T cells to make both IL-2 and IFN-γ is dependent on cell type and is influenced by IFN-γ signaling. (A) Example of dual IL-2 and IFN-γ ICS of splenocytes from wt B6 (top row) or IFN-γR1−/− (bottom row) mice on day 14 p.i. Dot plots were first gated on CD4+ Thy1.2+ cells. Frequencies are of the gated CD4+ Thy1.2+ population. (B) Frequencies of IL-2+ IFN-γ+ cells of total IFN-γ+ LLO190-201-specific CD4 T cells from wt B6 (triangles) or IFN-γR1−/− (squares) mice. The number of mice per group per time point was three to six. *, P value of <0.05 as determined using the Student t test. (C) Example of dual ICS of splenocytes from wt B6 (top row) or IFN-γR1−/− (bottom row) mice for IFN-γ and IL-2 on day 35 p.i. Dot plots were first gated on CD8+ Thy1.2+ cells. Frequencies are of the gated CD8+ Thy1.2+ population. (D) Frequencies of IL-2+ IFN-γ+ cells of total IFN-γ+ OVA257-264-specific CD8 T cells from wt B6 (triangles) or IFN-γR1−/− (squares) mice. The number of mice per group per time point was three to six. *, P value of <0.05 as determined using the Student t test.
FIG. 6.
FIG. 6.
Expression of CD127 by Ag-specific CD4 and CD8 T cells is higher in the absence of IFN-γR1. (A) Example of combined surface staining for CD127 and ICS for IFN-γ on splenocytes from wt B6 (top row) or IFN-γR1−/− (bottom row) mice on day 14 p.i. Dot plots were first gated on CD4+ cells. Histograms are gated on CD4+ Thy1.2+ IFN-γ+ cells. Frequency IFN-γ positive is of the gated CD4+ population. Frequency CD127 positive is of the gated CD4+ Thy1.2+ IFN-γ+ population. (B) Frequency of LLO190-201-specific CD4 T cells that were CD127 positive in wt B6 (triangles) or IFN-γR1−/− (squares) mice. The number of mice per group per time point was three to six. *, P value of <0.05 as determined using the Student t test. (C) Example of combined surface staining for CD127 and ICS for IFN-γ on splenocytes from wt B6 (top row) or IFN-γR1−/− (bottom row) mice on day 35 p.i. Dot plots were first gated on Thy1.2+ cells. Histograms are gated on CD8+ Thy1.2+ IFN-γ+ cells. Frequency IFN-γ positive is of the gated CD8+ Thy1.2+ population. Frequency CD127 positive is of the gated CD8+ Thy1.2+ IFN-γ+ population. (D) Frequency of OVA257-264-specific CD8 T cells that were CD127 positive in wt B6 (triangles) or IFN-γR1−/− (squares) mice at the times p.i. indicated on the x axis. The number of mice per group per time point was three to six. *, P value of <0.05 as determined using the Student t test.
FIG. 7.
FIG. 7.
IFN-γR1−/− Ag-specific T cells proliferate in response to secondary infection. IFN-γR1−/− and wt mice on day 80 post-primary infection were challenged with actA-deficient L. monocytogenes OVA. Numbers of Ag-specific T cells were determined by ICS for IFN-γ. (A) Kinetics of LLO190-201-specific CD4 T cells responding to secondary infection for IFN-γR1−/− (squares) or wt (triangles) B6 mice. There were three mice per group per time point. (B) Kinetics of OVA257-264-specific CD8 T cells responding to secondary infection for IFN-γR1−/− (squares) or wt B6 (triangles) mice. There were three mice per group per time point.

References

    1. Altman, J. D., P. A. Moss, P. J. Goulder, D. H. Barouch, M. G. McHeyzer-Williams, J. I. Bell, A. J. McMichael, and M. M. Davis. 1996. Phenotypic analysis of antigen-specific T lymphocytes. Science 274:94-96. - PubMed
    1. Bach, E. A., M. Aguet, and R. D. Schreiber. 1997. The IFN γ receptor: a paradigm for cytokine receptor signaling. Annu. Rev. Immunol. 15:563-591. - PubMed
    1. Bach, E. A., S. J. Szabo, A. S. Dighe, A. Ashkenazi, M. Aguet, K. M. Murphy, and R. D. Schreiber. 1995. Ligand-induced autoregulation of IFN-γ receptor β chain expression in T helper cell subsets. Science 270:1215-1218. - PubMed
    1. Badovinac, V. P., and J. T. Harty. 2000. Intracellular staining for TNF and IFN-γ detects different frequencies of antigen-specific CD8+ T cells. J. Immunol. Methods 238:107-117. - PubMed
    1. Badovinac, V. P., K. A. Messingham, S. E. Hamilton, and J. T. Harty. 2003. Regulation of CD8+ T cells undergoing primary and secondary responses to infection in the same host. J. Immunol. 170:4933-4942. - PubMed

Publication types

MeSH terms