. 2006 Sep 11;174(6):815-25.
doi: 10.1083/jcb.200604015.

The elementary unit of store-operated Ca2+ entry: local activation of CRAC channels by STIM1 at ER-plasma membrane junctions

Affiliations

The elementary unit of store-operated Ca2+ entry: local activation of CRAC channels by STIM1 at ER-plasma membrane junctions

Riina M Luik et al. J Cell Biol. .

Abstract

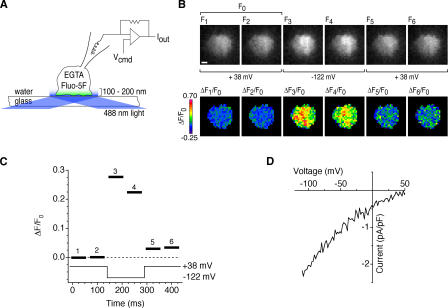
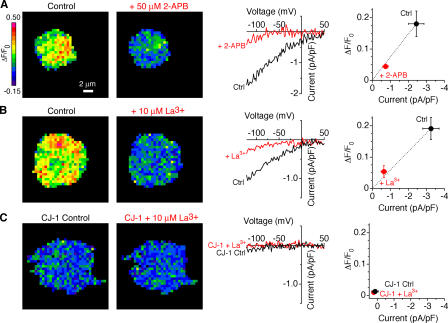
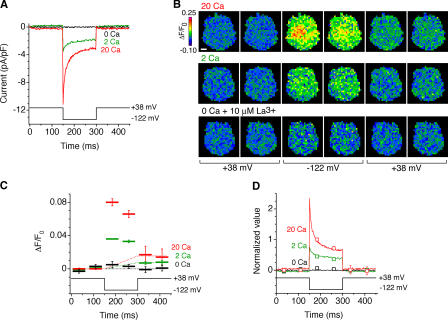
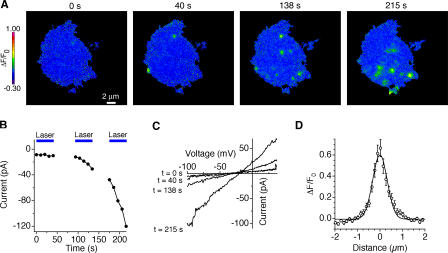
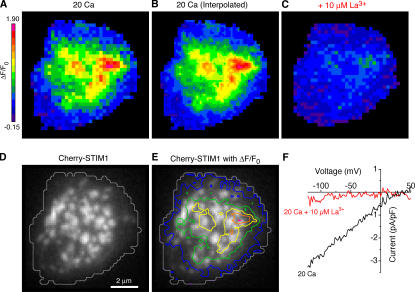
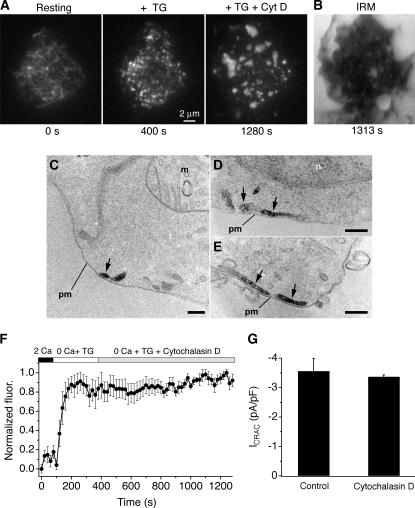
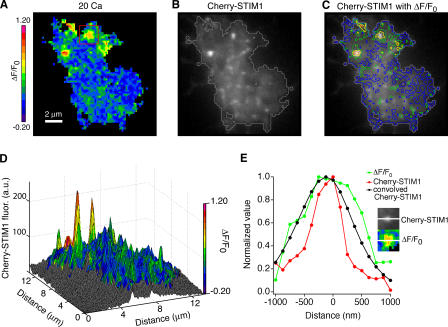
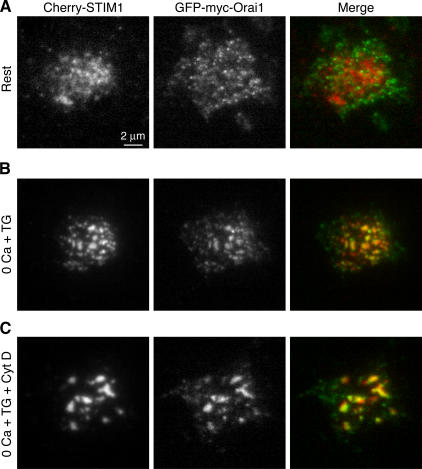
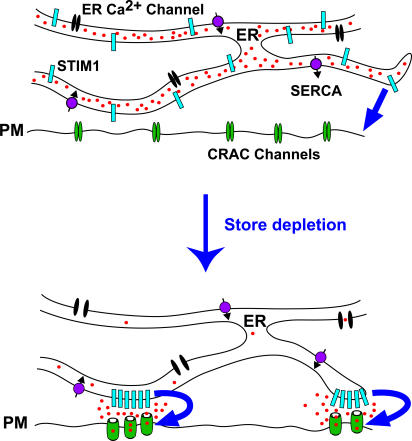
The activation of store-operated Ca(2+) entry by Ca(2+) store depletion has long been hypothesized to occur via local interactions of the endoplasmic reticulum (ER) and plasma membrane, but the structure involved has never been identified. Store depletion causes the ER Ca(2+) sensor stromal interacting molecule 1 (STIM1) to form puncta by accumulating in junctional ER located 10-25 nm from the plasma membrane (see Wu et al. on p. 803 of this issue). We have combined total internal reflection fluorescence (TIRF) microscopy and patch-clamp recording to localize STIM1 and sites of Ca(2+) influx through open Ca(2+) release-activated Ca(2+) (CRAC) channels in Jurkat T cells after store depletion. CRAC channels open only in the immediate vicinity of STIM1 puncta, restricting Ca(2+) entry to discrete sites comprising a small fraction of the cell surface. Orai1, an essential component of the CRAC channel, colocalizes with STIM1 after store depletion, providing a physical basis for the local activation of Ca(2+) influx. These studies reveal for the first time that STIM1 and Orai1 move in a coordinated fashion to form closely apposed clusters in the ER and plasma membranes, thereby creating the elementary unit of store-operated Ca(2+) entry.


Figures

Figure 1.
Figure 1.
A method for visualizing active CRAC channels. (A) TIRF imaging during whole-cell recording from a single Jurkat cell. EGTA and fluo-5F are introduced into the cell through the recording pipette. TIRF illumination restricts the excitation of fluo-5F to within ∼200 nm of the coverslip, and EGTA suppresses increases in global [Ca2+]i while it depletes Ca2+ stores. The patch-clamp command voltage (Vcmd) controls the driving force for Ca2+ entry through open CRAC channels. (B) Fluo-5F fluorescence images show a rapid, reversible fluorescence increase during a voltage step from +38 to −122 mV. ΔF/F0 images (bottom) were calculated by normalizing raw fluorescence images (top) to the mean of two control images collected at +38 mV (F0). Bar, 2 μm. (C) ΔF/F0 values averaged over the cell footprint (black bars) for each ratiometric image. ΔF/F0 values change within 10–60 ms of changes in membrane potential. The bar width indicates the camera exposure time. (D) Current evoked by voltage ramps from −122 to +50 mV during the experiment, showing the inward rectification typical of ICRAC.
Figure 2.
Figure 2.
Fluo-5F fluorescence signals arise from CRAC channels. Pseudocolor images indicate ΔF/F0 at –122 mV from three cells as described in Fig. 1 A. ΔF/F0 signals (left) and membrane currents (middle) are inhibited by 2-APB (A) and La3+ (B). (C) ΔF/F0 signals are absent in CRAC-deficient CJ-1 Jurkat cells. The slight suppression of fluorescence by 10 μM La3+ is consistent with the residual amount of ICRAC observed in CJ-1 cells. The graphs on the right show that the ΔF/F0 signals vary in proportion to ICRAC for all conditions. A, n = 6 cells; B, n = 4 cells; C, n = 4 cells.
Figure 3.
Figure 3.
Fluo-5F monitors local [Ca2+]i near open channels. (A) Fast Ca2+-dependent inactivation of ICRAC. Current responses of a single cell to hyperpolarization in the presence of 0, 2, or 20 mM Ca2+ are shown. (B) ΔF/F0 images acquired during the current recordings shown in A. Bar, 2 μm. (C) ΔF/F0 plotted with voltage for each of the images in B, averaged over four stimulus presentations. The dashed lines show the estimated rise of the global component of ΔF/F0 for each [Ca2+]o. (D) The ΔF/F0 signal closely tracks the time course of ICRAC, indicating that it monitors local [Ca2+]i near CRAC channels. ΔF/F0 values (squares) after subtraction of the global component are plotted relative to the maximal ΔF/F0 image (acquired from 10–60 ms after a hyperpolarizing voltage step in 20 mM Cao 2+). ICRAC traces (solid lines) are normalized to the mean ICRAC during acquisition of the maximal ΔF/F0 image.
Figure 4.
Figure 4.
Ca2+ influx through a light-activated pathway can be localized with submicrometer resolution. (A) Induction of light-activated Ca2+ influx in CRAC-deficient CJ-1 Jurkat mutants during repeated exposures to unattenuated 488-nm laser light. After 40 s of constant illumination, discrete sites of Ca2+ influx began to appear at the cell footprint; the magnitude and prevalence of these Ca2+ “hotspots” increased with prolonged laser illumination. Voltage, −112 mV. (B) Mean inward current at −112 mV during the experiment in A. Blue bars indicate periods of laser illumination. (C) Current–voltage relations collected during the same experiment show induction of a nonselective conductance. (D) The mean radial spread of ΔF/F0 through cross-sections of 32 hotspots. A Gaussian curve fitted to the data shows that ΔF/F0 declines by 50% within 377 nm.
Figure 5.
Figure 5.
Regions of CRAC-mediated Ca2+ influx overlap with STIM1 puncta. (A) ΔF/F0 image from a Jurkat cell collected 10–60 ms after a hyperpolarizing voltage step to −122 mV. (B) Linear interpolation of the ΔF/F0 image in A to equalize the number of pixels to the Cherry-STIM1 image in D. (C and F) 10 μM La3+ inhibited both ΔF/F0 and ICRAC in this cell, confirming that ΔF/F0 arises from CRAC channels. (D) TIRF image of Cherry-STIM1 in the same cell. A gray contour line outlines the fluo-5F footprint depicted in A. (E) Pseudocolored contour lines of Ca2+ influx density from B overlaid on the Cherry-STIM1 image show the overlap of Ca2+ influx sites with Cherry-STIM1 puncta.
Figure 6.
Figure 6.
Cytochalasin D reorganizes STIM1 puncta in Jurkat cells. (A) TIRF images of Cherry-STIM1 in an intact cell. Initially, Cherry-STIM1 was diffusely distributed within the ER (left) but redistributed into puncta after 5 min of treatment with 0 mM Cao 2+ plus 1 mM EGTA and 1 μM TG (middle). After a subsequent 15-min exposure to 5 μM cytochalasin D, the puncta coalesced into large, sparsely distributed structures (right). The complete image sequence is shown in Video 1 (available at http://www.jcb.org/cgi/content/full/jcb.200604015/DC1). (B) An IRM image of the cell footprint after 16 min of cytochalasin D treatment shows persistent adherence of the cell to the coverslip. (C–E) Electron micrographs from cells treated with TG plus cytochalasin D as in A, showing the distribution of HRP-STIM1 in ER tubules (arrows) located next to the plasma membrane (pm). n, nucleus; m, mitochondrion. Bars, 200 nm. (F) Cytochalasin D does not affect the integrated fluorescence of Cherry-STIM1 puncta near the plasma membrane. The fluorescence increases in response to store depletion (TG) because of the formation of puncta but is constant after 15 min of subsequent cytochalasin D treatment (n = 7 cells). (G) Cytochalasin D does not affect maintenance of ICRAC. ICRAC density was measured at −122 mV in Cherry-STIM1–transfected cells after >15 min of pretreatment with TG ± 5 μM cytochalasin D (n = 4 cells each). Because ICRAC activates well before cytochalasin D causes any noticeable changes in ER structure, this experiment tests its effect on the maintenance rather than the activation of ICRAC.
Figure 7.
Figure 7.
Open CRAC channels colocalize with STIM1 puncta in cytochalasin D–treated cells. TIRF images of ΔF/F0 (A) and Cherry-STIM1 fluorescence (B) in a Jurkat cell treated for 15 min with 0-Ca2+ Ringer's plus 1 mM EGTA, 1 μM TG, and 5 μM cytochalasin D. ΔF/F0 was linearly interpolated as in Fig. 5 B. A gray contour line outlines the fluo-5F footprint in B. (C) Pseudocolored contour lines of Ca2+ influx density overlaid on the Cherry-STIM1 image show that Ca2+ influx sites are associated with bright STIM1 puncta. (D) Overlay of the pseudocolored ΔF/F0 map on a surface plot of Cherry-STIM1 fluorescence. (E) Comparison of the spatial extent of Cherry-STIM1 and ΔF/F0 at a single Ca2+ influx site. The intensity profiles through the center of a single Cherry-STIM1 punctum and its associated Ca2+ influx site (inset; taken from the boxed area in A) are shown. The radial spread of ΔF/F0 is centered on the Cherry-STIM1 profile. Convolution of the Cherry-STIM1 fluorescence curve with the diffusional spread function for fluo-5F yields a curve (black line) that is similar in extent to ΔF/F0.
Figure 8.
Figure 8.
Orai1 colocalizes with STIM1 at peripheral ER–plasma membrane junctions after store depletion. TIRF imaging of a Jurkat cell transiently coexpressing Cherry-STIM1 and GFP-myc-Orai1 before and after store depletion. (A) In cells bathed in 2 mM Ca2+, Cherry-STIM1 is distributed throughout the ER (left), whereas GFP-myc-Orai1 is distributed throughout the cell footprint (middle). The merged image (right) shows little overlap of Orai1 (green) and STIM1 (red). (B) After a 5-min treatment with 1 μM TG in 0-Ca2+ Ringer's plus 1 mM EGTA, both Cherry-STIM1 (left) and GFP-myc-Orai1 (middle) colocalize at discrete puncta, as shown in the merged image (right). Similar results were seen in 14 out of 16 cells. (C) After a subsequent 15-min exposure to 5 μM cytochalasin D, Cherry-STIM1 (left) and GFP-myc-Orai1 (middle) remained localized in coalesced puncta (right).
Figure 9.
Figure 9.
Local activation of CRAC channels by STIM1 at ER–plasma membrane junctions. Store depletion causes STIM1 to accumulate in preexisting and newly formed regions of junctional ER, whereas Orai1 accumulates in apposed regions of the plasma membrane. CRAC channels open only in the close vicinity of the STIM1 puncta. The convergence of STIM1 and Orai1 at ER–plasma membrane junctions creates the elementary unit of SOCE.

Similar articles

Cited by

References

    1. Al-Mohanna, F.A., E.J. Pettit, and M.B. Hallett. 1997. Does actin polymerization status modulate Ca2+ storage in human neutrophils? Release and coalescence of Ca2+ stores by cytochalasins. Exp. Cell Res. 234:379–387. - PubMed
    1. Bautista, D.M., M. Hoth, and R.S. Lewis. 2002. Enhancement of calcium signalling dynamics and stability by delayed modulation of the plasma-membrane calcium-ATPase in human T cells. J. Physiol. 541:877–894. - PMC - PubMed
    1. Cheng, H., W.J. Lederer, and M.B. Cannell. 1993. Calcium sparks: elementary events underlying excitation-contraction coupling in heart muscle. Science. 262:740–744. - PubMed
    1. Fagan, K.A., R. Mahey, and D.M. Cooper. 1996. Functional co-localization of transfected Ca2+-stimulable adenylyl cyclases with capacitative Ca2+ entry sites. J. Biol. Chem. 271:12438–12444. - PubMed
    1. Fanger, C.M., M. Hoth, G.R. Crabtree, and R.S. Lewis. 1995. Characterization of T cell mutants with defects in capacitative calcium entry: genetic evidence for the physiological roles of CRAC channels. J. Cell Biol. 131:655–667. - PMC - PubMed

Publication types

MeSH terms