. 2006 Oct;128(4):423-41.
doi: 10.1085/jgp.200609521. Epub 2006 Sep 11.

State-dependent block of BK channels by synthesized shaker ball peptides

Affiliations

State-dependent block of BK channels by synthesized shaker ball peptides

Weiyan Li et al. J Gen Physiol. 2006 Oct.

Abstract

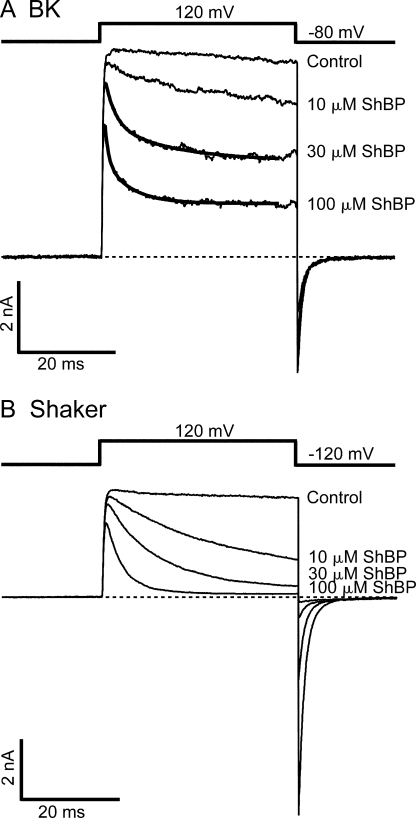
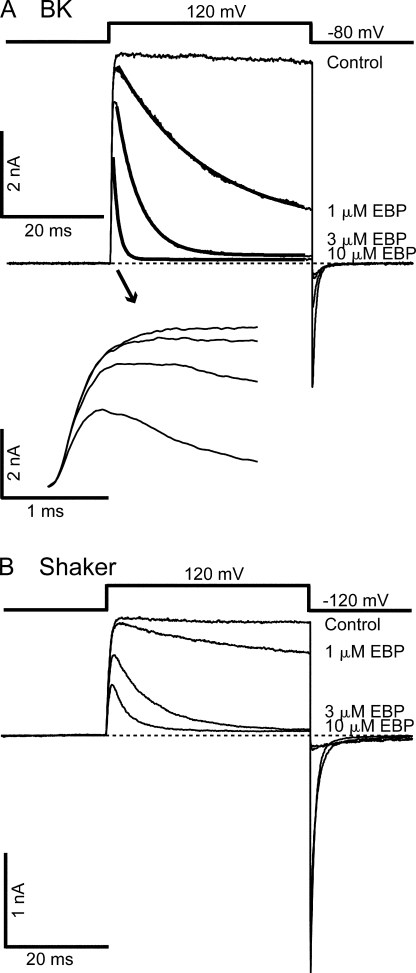
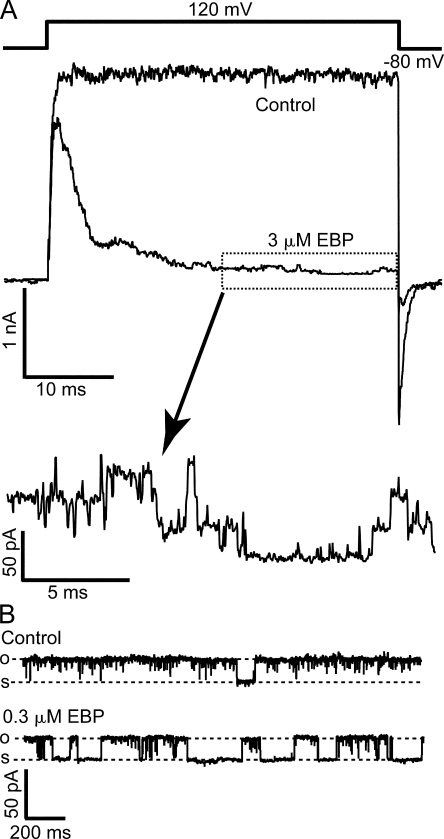
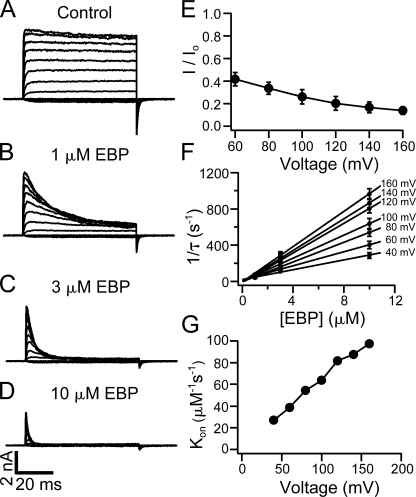
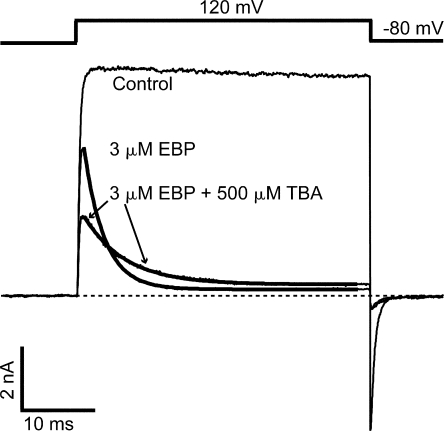
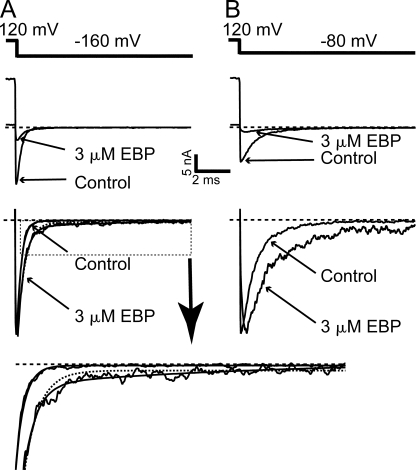
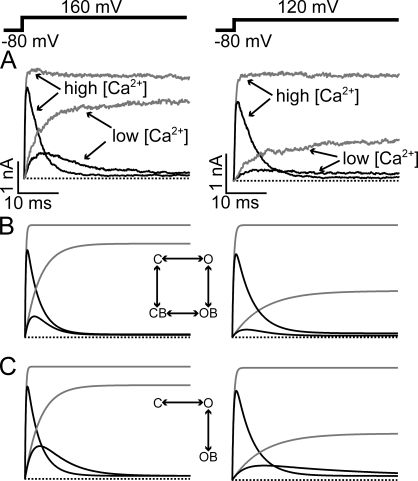
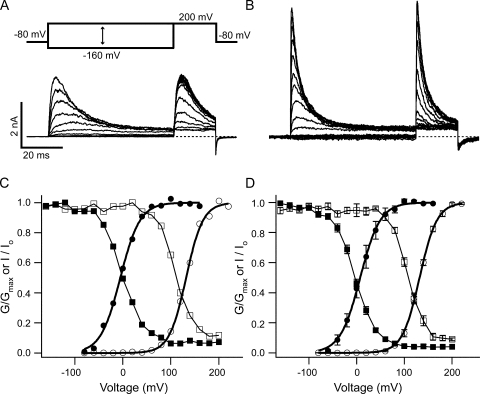
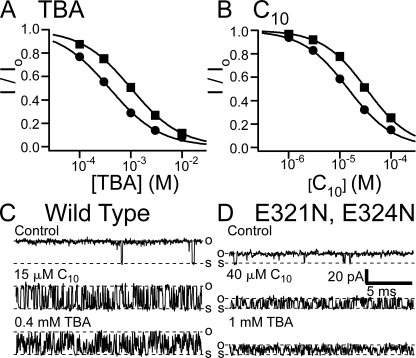
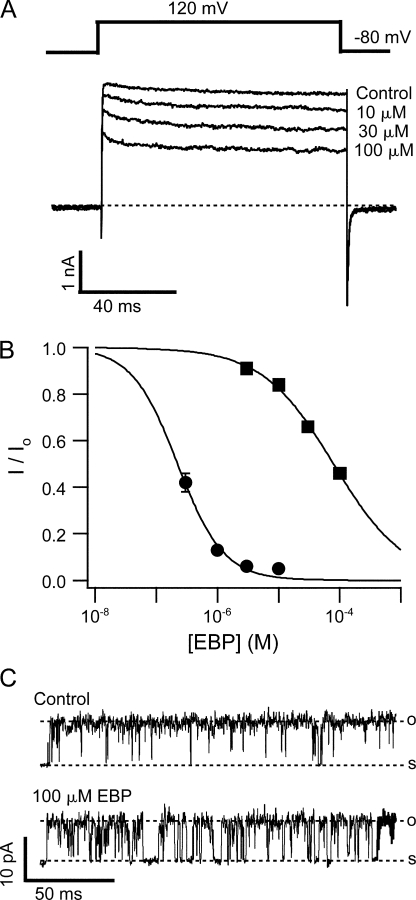
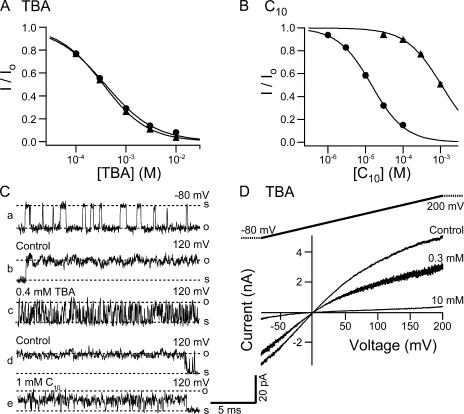
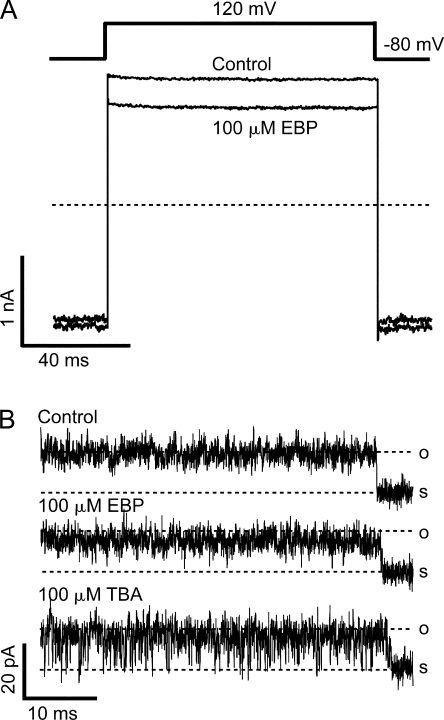
Crystal structures of potassium channels have strongly corroborated an earlier hypothetical picture based on functional studies, in which the channel gate was located on the cytoplasmic side of the pore. However, accessibility studies on several types of ligand-sensitive K(+) channels have suggested that their activation gates may be located near or within the selectivity filter instead. It remains to be determined to what extent the physical location of the gate is conserved across the large K(+) channel family. Direct evidence about the location of the gate in large conductance calcium-activated K(+) (BK) channels, which are gated by both voltage and ligand (calcium), has been scarce. Our earlier kinetic measurements of the block of BK channels by internal quaternary ammonium ions have raised the possibility that they may lack a cytoplasmic gate. We show in this study that a synthesized Shaker ball peptide (ShBP) homologue acts as a state-dependent blocker for BK channels when applied internally, suggesting a widening at the intracellular end of the channel pore upon gating. This is consistent with a gating-related conformational change at the cytoplasmic end of the pore-lining helices, as suggested by previous functional and structural studies on other K(+) channels. Furthermore, our results from two BK channel mutations demonstrate that similar types of interactions between ball peptides and channels are shared by BK and other K(+) channel types.


Figures

Figure 1.
Figure 1.
Time-dependent blockage of BK and Shaker currents by synthesized ShBP. (A) Macroscopic BK currents were recorded from an inside-out patch exercised from an oocyte expressing mslo construct. Currents elicited by the voltage protocol shown above were recorded under voltage clamp in the absence (control) and presence of 10, 30, and 100 μM ShBP. Currents in the presence of 30 and 100 μM ShBP were fitted with double exponential time course (thick smooth lines). Time constants in the fitting are τfast= 2.0 ms, τslow= 13.1 ms (30 μM), and τfast= 0.7 ms, τslow= 5.2 ms (100 μM). (B) Macroscopic Shaker currents were recorded from an inside-out patch exercised from an oocyte expressing ShB Δ6-46 construct. Recording conditions were the same as in A except for the holding potential of −120 instead of −80 mV. Macroscopic currents shown in this and other figures represent the average of four to eight consecutive traces unless otherwise noted. Dashed lines in this and other figures indicate zero current level for macroscopic currents.
Figure 2.
Figure 2.
EBP demonstrates slower block and higher affinity than ShBP in BK channels. (A) Macroscopic BK currents recorded at 120 mV are shown in the absence (control) and presence of 1, 3, and 10 μM EBP. Currents in the presence of blocker are fitted with single exponential time course (thick smooth lines). Time constants in the fitting are τ = 17.6 ms (1 μM), τ = 4.5 ms (3 μM), and τ = 1.1 ms (10 μM). The first 2 ms of the currents during depolarization were amplified in the inset below to illustrate the activation. (B) Macroscopic Shaker currents recorded in the absence (control) and presence of 1, 3, and 10 μM EBP with the voltage protocol shown above the traces.
Figure 3.
Figure 3.
Steady-state block of BK channels by EBP is dominated by long block events. (A) Macroscopic BK currents were recorded before (control) and after the application of 3 μM EBP. Voltage protocol is shown above the traces. Currents were not leak subtracted nor averaged in order to demonstrate the unaltered single channel openings. The segment of current enclosed in the dotted box was amplified both vertically and horizontally to visualize single channel currents. (B) Single channel recordings of BK currents in the absence (control) and presence of 0.3 μM EBP at 80 mV. Records were digitally filtered at 1 kHz. Dashed lines in this and other single channel records indicate open and shut levels, as marked by “o” and “s.” In the presence of blockers, open and shut levels are determined based on the current amplitude in control records. When channel closure is rare, occasional long shut segments are deliberately included in single channel records in order to show the shut levels.
Figure 4.
Figure 4.
Voltage and concentration dependence in the block of BK channels by EBP. Macroscopic BK currents were recorded in response to depolarizations of membrane potential from −80 to 160 mV at 20-mV steps. Current families are shown in the absence (A) and presence of 1 μM EBP (B), 3 μM EBP (C), and 10 μM EBP (D). (E) Remaining fractions of currents in the presence of 1 μM EBP (compared with control) at the end of 60-ms pulses at positive potentials were measured from six patches, and the average and SEM are plotted as a function of membrane potential. Error bars representing SEM in this and other figures are often smaller than the symbols. Note in B that currents may not reach steady state within 60 ms at all potentials in the presence of 1 μM EBP. (F) EBP block is fitted with single exponential time course at positive potentials in the presence of 1, 3, and 10 μM EBP from six patches. The reciprocals of the time constant (1/τ) are averaged and plotted as a function of EBP concentration with error bars representing SEM. The relations between 1/τ and EBP concentration are fitted with straight lines at each potential. (G) Kon values measured by the slope of the fitted lines in F are plotted as a function of membrane potential. The solid lines connecting the data points in E and G have no physical meaning.
Figure 5.
Figure 5.
Apparent EBP block rate of BK channels is slowed by TBA. Macroscopic BK currents elicited by the shown voltage protocol were recorded without blockers (control), with 3 μM EBP, and with 500 μM TBA in addition to 3 μM EBP. Currents in the presence of 3 μM EBP are fitted with single exponential time course (thick smooth lines). Time constants used in the fitting are τ = 2.8 ms (3 μM EBP alone) and τ = 5.6 ms (3 μM EBP plus 500 μM TBA).
Figure 6.
Figure 6.
Deactivation of BK channels is slowed by EBP. (A) After a depolarization to 120 mV, tail currents were recorded at −160 mV in the absence (control) and presence of 3 μM EBP. Large currents were deliberately selected for better visualization of the tail currents. Pipette access resistance in bath in this experiment was 0.8 MΩ. Tail currents normalized to their peak amplitude are shown in the bottom panels. Normalized control tail current at −160 mV is fitted with a single exponential time course (smooth line) with τ = 0.25 ms, while normalized tail current in 3 μM EBP is fitted with double exponential time course (smooth line) with time constants of τfast= 0.37 ms and τslow= 7.3 ms. Dotted line is an attempt to fit the tail current in 3 μM EBP with a single exponential component (see the zoomed view of the traces inside the dotted box in the bottom panel). (B) Tail currents at −80 mV in the absence (control) and presence of 3 μM EBP. Note the “hook” in the normalized tail current in the presence of 3 μM EBP.
Figure 7.
Figure 7.
Dependence of EBP block on activation kinetics suggests state-dependent-block mechanism. (A) Macroscopic BK currents in the absence (gray traces) and presence (black traces) of 3 μM EBP were recorded at 160 and 120 mV in High and Low Ca2+ solutions. (B) Simulated currents at two different potentials using the completely state-independent-block model shown in the inset. Activation kinetic parameters in the modeling were obtained from single exponential fitting of the activation time course and averaged Po at given membrane potentials in control currents in each Ca2+ concentration. The block rates were determined by the steady-state block level and single exponential fitting of the current decay in High Ca2+, where the activation is much faster compared with the rate of block. The two horizontal transitions are assumed to have the same rates, so are the two vertical transitions. (C) Simulated currents using a classic open-channel-block model shown in the inset. All rates that are present in this model are the same as in B. All channels are assumed to be at the closed and unblocked state before depolarization in both B and C.
Figure 8.
Figure 8.
Block of BK channels by EBP is dependent on the open probability. Macroscopic BK currents in the presence of 3 μM EBP were recorded using the shown voltage protocol. From a holding potential at −80 mV, membrane potential was stepped to a value between −160 and 200 mV at 20-mV steps for 60 ms, followed by a 20-ms test pulse at 200 mV. Currents shown in A and B are from the same patch with different Ca2+ concentrations. Low Ca2+ solution was used in A and High Ca2+ in B. (C) From the same patch shown in A and B, the relative conductance of macroscopic BK channels as a function of membrane potential was determined in the absence of EBP by isochronal tail current amplitude at −80 mV with Low (open circles) or High Ca2+ solution (solid circles). Both sets of data were fitted with the Boltzmann function G = Gmax/(1 + exp(−zF(V − V1/2)/RT)) (smooth lines) and then normalized to the maximum of the fit. In this function, V1/2 is the membrane potential at which half of the channels are open, and z is the apparent equivalent gating charge, while all other parameters have their normal meanings. Values used for the fitting are V1/2 = 131.8 mV, z = 1.46 (Low Ca2+) and V1/2 = –5.1 mV, z = 1.25 (High Ca2+). Relative peak current amplitudes (I/Io, Io is the maximal peak amplitude in the presence of EBP) during the test pulse in A and B are shown together with the Po-V curves as functions of the prepulse membrane potential for Low Ca2+ (open squares) and High Ca2+ (solid squares). Lines connecting the squares have no physical meaning. (D) Same experiments described in A–C were repeated on three other patches. The average of the four patches is plotted with SEM. Values used to fit the Po-V relations (smooth lines) are V1/2 = 131.9 mV, z = 1.41 (Low Ca2+) and V1/2 = 7.0 mV, z = 1.22 (High Ca2+).
Figure 9.
Figure 9.
Affinities and association rates for QA blockers are reduced in the E321N, E324N mutant. (A) Dose–response curves for TBA block of the E321N, E324N mutant (solid squares) and wild-type BK channels (solid circles). Remaining fractions of steady-state currents at 120 mV in the presence of different concentrations of TBA were determined from five patches for wild type and nine patches for the mutant. The average values and SEM are plotted as functions of TBA concentration. Smooth lines are fitted curves with Hill equation: I/Io= 1/(1 + ([TBA]/Kd)n). Values used in the fitting are Kd = 1.01 mM, n = 0.89 (mutant) and Kd = 0.38 mM, n = 0.87 (wild type). (B) Dose–response curves for C10 block of the E321N, E324N mutant (solid squares) and wild-type BK channels (solid circles). Remaining fractions of steady-state currents at 100 mV in the presence of different concentrations of C10 were determined from eight patches for the mutant and six patches for wild-type BK channels. The average values and SEM are plotted as functions of C10 concentration. Smooth lines are fitting curves of the data with Hill equation: I/Io= 1/(1 + ([C10]/Kd)n). Values used in the fitting are Kd = 32.8 μM, n = 1.01 (mutant) and Kd = 14.5 μM, n = 0.97 (wild type). (C) Single channel recordings of a wild-type BK channel at 120 mV in the absence (control) and presence of 15 μM C10 or 0.4 mM TBA. (D) Single channel recordings of an E321N, E324N channel at 120 mV in the absence (control) and presence of 40 μM C10 or 1 mM TBA.
Figure 10.
Figure 10.
The E321N, E324N mutation affects both affinity and kinetics of EBP block. (A) Macroscopic currents were recorded from an inside-out patch expressing the E321N, E324N mutant channels at 120 mV in the absence (control) and presence of 10, 30, and 100 μM EBP. Currents were not leak subtracted by P/4 protocol due to significant openings even at very negative potentials. Instead, current recorded in the presence of 20 mM TBA from the same patch was subtracted from the traces to remove most of the leak and capacitance transient. TBA at this concentration blocks nearly 100% of mutant currents, as suggested in Fig. 9 A. (B) Dose–response curves for EBP block of the E321N, E324N mutant (solid squares) and wild-type BK channels (solid circles). Remaining fractions of steady-state currents at 120 mV in the presence of different concentrations of EBP were determined from 11 patches for mutant and 5 patches for wild-type BK channels. Very long pulses (500 ms) were used to determine the steady-state current levels when wild-type BK channels were treated with submicromolar concentration of EBP. The average values and SEM are plotted as functions of EBP concentration. Smooth lines are fitting curves of the data with Hill equation: I/Io= 1/ (1 + ([EBP]/Kd)n). Values used in the fitting are Kd = 89.0 μM, n = 0.72 (mutant) and Kd = 0.22 μM, n = 1.16 (wild type). (C) Single channel recordings of an E321N, E324N mutant channel at 80 mV in the absence (control) and presence of 100 μM EBP. Records were digitally filtered at 2 kHz.
Figure 11.
Figure 11.
TBA and C10 affinities are differentially affected in the S6/2-KcsA mutant. (A) Dose–response curves for TBA block of the S6/2-KcsA mutant (solid triangles) and wild-type BK channels (solid circles). Remaining fractions of steady-state currents at 120 mV in the presence of different concentrations of TBA were determined from five patches for the S6/2-KcsA channels. Wild-type dose–response is the same as shown in Fig. 9 A. The average values and SEM are plotted as functions of TBA concentration. Smooth lines are fitting curves with Hill equation: I/Io= 1/(1 + ([TBA]/Kd)n). Values used in the fitting are Kd = 0.35 mM, n = 0.97 (mutant) and Kd = 0.38 mM, n = 0.87 (wild type). (B) Dose–response curves for C10 block of the S6/2-KcsA mutant (solid triangles) and wild-type BK channels (solid circles). Remaining fractions of steady-state currents at 100 mV in the presence of different concentrations of C10 were determined from five patches for the S6/2-KcsA channels. Dose–response for wild-type BK channels is the same as shown in Fig. 9 B. The average values and SEM are plotted as functions of C10 concentration. Smooth lines are fitting curves of the data with Hill equation: I/Io= 1/(1 + ([C10]/Kd)n). Values used in the fitting are Kd = 1.06 mM, n = 0.95 (S6/2-KcsA) and Kd = 14.5 μM, n = 0.97 (wild type). (C) Single channel recordings of the S6/2-KcsA channels. a, b, and c are from one patch, d and e from another, at shown membrane potentials. (D) Macroscopic currents were recorded from an inside-out patch expressing the S6/2-KcsA mutant channels in response to a 200-ms voltage ramp from −80 to 200 mV. Shown traces are in the absence (control) and presence of 0.3 and 10 mM TBA. Currents are not leak subtracted.
Figure 12.
Figure 12.
EBP block of the S6/2-KcsA channels demonstrates a reduced apparent affinity and an enhanced dissociation rate. (A) Macroscopic currents were recorded from an inside-out patch expressing the S6/2-KcsA mutant channels in response to a depolarization of membrane potential to 120 mV before (control) and after the application of 100 μM EBP. Currents were not leak subtracted by P/4 protocol because channels don't close even at very negative potentials. Instead, current recorded in the presence of 20 mM TBA from the same patch was subtracted from the traces to remove most of the leak and capacitance transient. TBA at this concentration blocks nearly 100% of mutant currents, as suggested in Fig. 11 (A and D). (B) Single channel recording of an S6/2-KcsA channel in the absence (control) and presence of 100 μM EBP or 100 μM TBA.

Similar articles

Cited by

References

    1. Armstrong, C.M., and B. Hille. 1972. The inner quaternary ammonium ion receptor in potassium channels of the node of Ranvier. J. Gen. Physiol. 59:388–400. - PMC - PubMed
    1. Bers, D.M. 1982. A simple method for the accurate determination of free [Ca] in Ca-EGTA solutions. Am. J. Physiol. 242:C404–C408. - PubMed
    1. Brelidze, T.I., and K.L. Magleby. 2005. Probing the geometry of the inner vestibule of BK channels with sugars. J. Gen. Physiol. 126:105–121. - PMC - PubMed
    1. Brelidze, T.I., X. Niu, and K.L. Magleby. 2003. A ring of eight conserved negatively charged amino acids doubles the conductance of BK channels and prevents inward rectification. Proc. Natl. Acad. Sci. USA. 100:9017–9022. - PMC - PubMed
    1. Bruening-Wright, A., M.A. Schumacher, J.P. Adelman, and J. Maylie. 2002. Localization of the activation gate for small conductance Ca2+-activated K+ channels. J. Neurosci. 22:6499–6506. - PMC - PubMed

Publication types

MeSH terms

Substances