. 2006 Sep 19;103(38):14234-9.
doi: 10.1073/pnas.0602768103. Epub 2006 Sep 11.

Cross-protective immunity can account for the alternating epidemic pattern of dengue virus serotypes circulating in Bangkok

Affiliations

Cross-protective immunity can account for the alternating epidemic pattern of dengue virus serotypes circulating in Bangkok

B Adams et al. Proc Natl Acad Sci U S A. .

Abstract

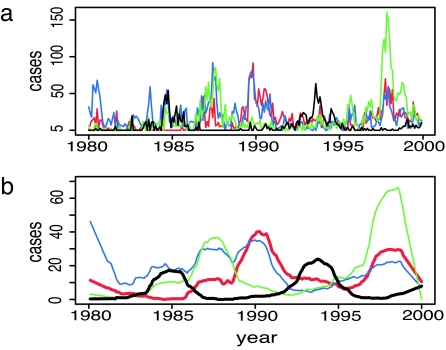
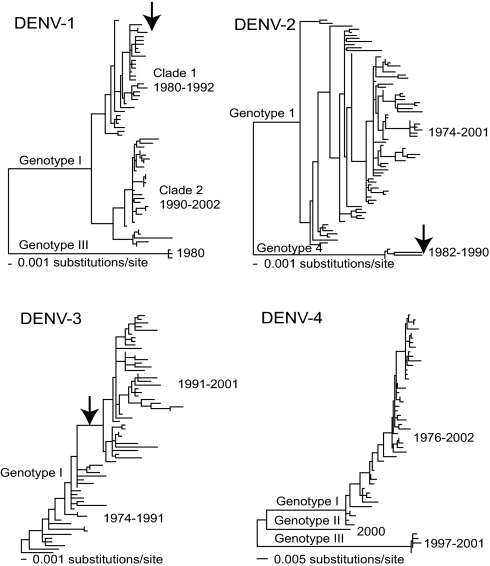
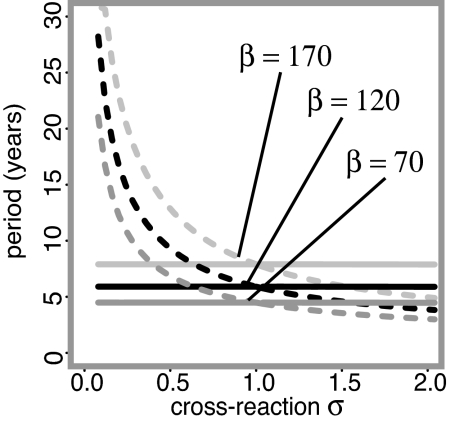
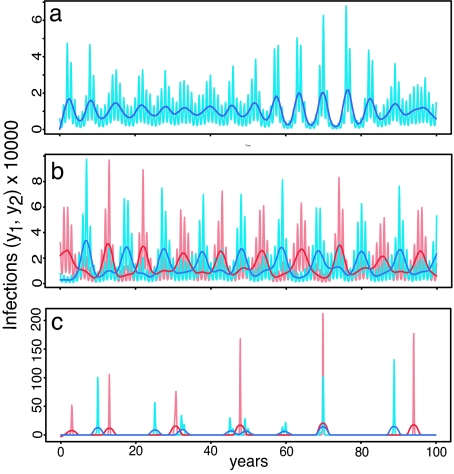
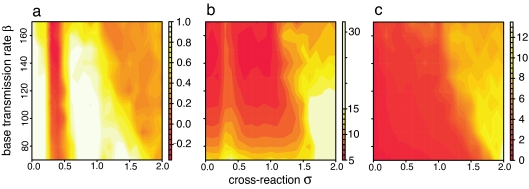
Dengue virus, the causative agent of dengue fever and its more serious manifestation dengue hemorrhagic fever, is widespread throughout tropical and subtropical regions. The virus exists as four distinct serotypes, all of which have cocirculated in Bangkok for several decades with epidemic outbreaks occurring every 8-10 years. We analyze time-series data of monthly infection incidence, revealing a distinctive pattern with epidemics of serotypes 1, 2, and 3 occurring at approximately the same time and an isolated epidemic of serotype 4 occurring in the intervening years. Phylogenetic analysis of virus samples collected over the same period shows that clade replacement events are linked to the epidemic cycle and indicates that there is an interserotypic immune reaction. Using an epidemic model with stochastic seasonal forcing showing 8- to 10-year epidemic oscillations, we demonstrate that moderate cross-protective immunity gives rise to persistent out-of-phase oscillations similar to those observed in the data, but that strong or weak cross-protection or cross-enhancement only produces in-phase patterns. This behavior suggests that the epidemic pattern observed in Bangkok is the result of cross-protective immunity and may be significantly altered by changes in the interserotypic immune reaction.


Conflict of interest statement

Conflict of interest statement: No conflicts declared.

Figures

Fig. 1.
Fig. 1.
Monthly confirmed cases of each dengue serotype at Queen Sirikit National Institute of Child Health, Bangkok 1980 to 2000. (a) Incidence of each serotype after adjusting as if the serotype was isolated in 100% of cases every month. (b) Adjusted data after removing the seasonal effect and smoothing. Red, DENV-1; blue, DENV-2; green, DENV-3; black, DENV-4.
Fig. 2.
Fig. 2.
Phylogenetic relationships of dengue virus in Bangkok, Thailand, sampled from 1973–2001. All four DENV serotypes are shown. Major genotypes and clades within genotypes are indicated, as are the range of sampling times within in each group. The phylogenetic events in DENV-1, DENV-2, and DENV-3 that coincide with the changing prevalence of DENV-4, particularly clade turnover, are indicated by arrows. All horizontal branch lengths are drawn to scale.
Fig. 3.
Fig. 3.
Natural periods, depending on the degree of cross-reaction σ, calculated from eigenvalues of the unforced, linearized deterministic system. Solid lines correspond to solutions with an in-phase pattern; dashed lines to solutions with an out-of-phase pattern. Three values of β are shown: β = 170 (pale gray), β = 120 (black), and β = 70 (dark gray). Other parameter values are γ = 52 and μ = 1/60.
Fig. 4.
Fig. 4.
Sample solutions for the infected proportion of the population (y1, y2) generated from the stochastic model for different degrees of cross-reaction. Pale lines are model output; darker lines are the same data after removing seasonal components and smoothing. Red, serotype 1; blue, serotype 2. (a) σ = 0.1, strong cross-immunity, in-phase with approximate period 6. (b) σ = 0.4, intermediate cross-immunity, out-of-phase with approximate period 10. (c) σ = 1.6, cross-enhancement, very large, irregular epidemics with no clear pattern. Numerical solution was by fourth-order Runge–Kutta method. Initially, one serotype was introduced to a naïve population. After 500 years, the second serotype was introduced at a random time in a 50-year interval. The system then was solved for an additional 4,500 years to ensure a quasi-equilibrium state. Parameter values were δ = 0.1, β = 120, γ = 52, and μ = 1/60.
Fig. 5.
Fig. 5.
Indicators of the distribution of solution patterns as σ and β vary. (a) Average cross-correlation at lag 0 between time series for the number of infections with each serotype (y1, y2). (b) Average epidemic period for serotype 1. Calculated by dividing the length of the series in years by the total number of epidemic peaks in that time. (c) Average epidemic size for serotype 1, calculated by dividing the sum of the epidemic peaks by the total number of peaks. All diagrams are based on 100 years of model output, after removing seasonal effects and smoothing so that epidemics are clearly distinguishable, with 20 separate model runs for each value of β and σ. Other numerical details as in Fig. 4 legend. Parameter values were δ = 0.1, γ = 52, and μ = 1/60.

References

    1. Grenfell BT, Pybus OG, Gog JR, Wood JLN, Daly JM, Mumford JA, Holmes EC. Science. 2004;303:327–332. - PubMed
    1. WHO. State of the Art of New Vaccines: Research and Development Initiative for Vaccine Research. Geneva: WHO; 2003.
    1. Halstead SB. In: Dengue and Dengue Hemorrhagic Fever. Gubler DJ, Kuno G, editors. New York: CABI; 1997. pp. 23–44.
    1. Rothman AL. J Clin Invest. 2004;113:946–951. - PMC - PubMed
    1. Takada A, Kawaoka Y. Rev Med Virol. 2003;12:387–398. - PubMed

Publication types