

Mg2+-RNA interaction free energies and their relationship to the folding of RNA tertiary structures
- PMID: 16966612
- PMCID: PMC1599903
- DOI: 10.1073/pnas.0606409103
Mg2+-RNA interaction free energies and their relationship to the folding of RNA tertiary structures
Abstract
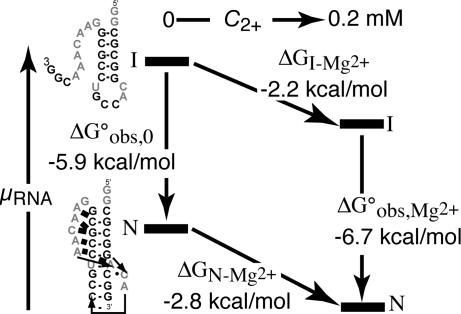
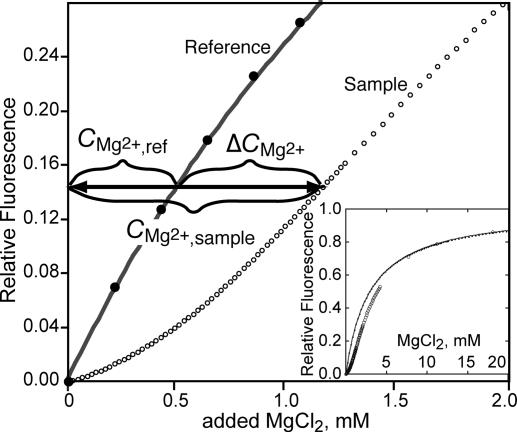
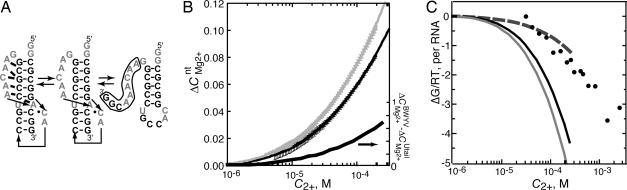
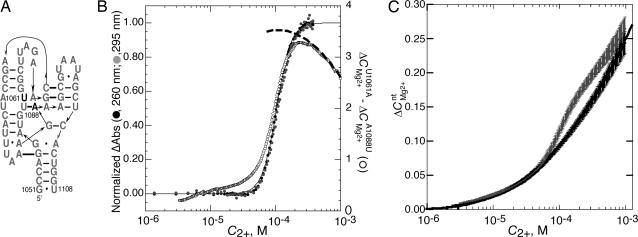
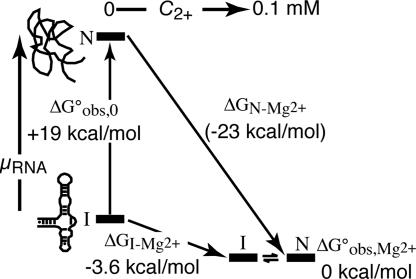
Mg2+ ions are very effective at stabilizing tertiary structures in RNAs. In most cases, folding of an RNA is so strongly coupled to its interactions with Mg2+ that it is difficult to separate free energies of Mg2+-RNA interactions from the intrinsic free energy of RNA folding. To devise quantitative models accounting for this phenomenon of Mg2+-induced RNA folding, it is necessary to independently determine Mg2+-RNA interaction free energies for folded and unfolded RNA forms. In this work, the energetics of Mg2+-RNA interactions are derived from an assay that measures the effective concentration of Mg2+ in the presence of RNA. These measurements are used with other measures of RNA stability to develop an overall picture of the energetics of Mg2+-induced RNA folding. Two different RNAs are discussed, a pseudoknot and an rRNA fragment. Both RNAs interact strongly with Mg2+ when partially unfolded, but the two folded RNAs differ dramatically in their inherent stability in the absence of Mg2+ and in the free energy of their interactions with Mg2+. From these results, it appears that any comprehensive framework for understanding Mg2+-induced stabilization of RNA will have to (i) take into account the interactions of ions with the partially unfolded RNAs and (ii) identify factors responsible for the widely different strengths with which folded tertiary structures interact with Mg2+.
Conflict of interest statement
Conflict of interest statement: No conflicts declared.
Figures
Similar articles
-
Tertiary structure of an RNA pseudoknot is stabilized by "diffuse" Mg2+ ions.Biochemistry. 2007 Mar 20;46(11):2973-83. doi: 10.1021/bi0616753. Epub 2007 Feb 23. Biochemistry. 2007. PMID: 17315982
-
Effects of Mg2+ on the free energy landscape for folding a purine riboswitch RNA.Biochemistry. 2011 Apr 12;50(14):2790-9. doi: 10.1021/bi101948k. Epub 2011 Mar 21. Biochemistry. 2011. PMID: 21361309 Free PMC article.
-
Importance of partially unfolded conformations for Mg(2+)-induced folding of RNA tertiary structure: structural models and free energies of Mg2+ interactions.Biochemistry. 2007 Sep 11;46(36):10266-78. doi: 10.1021/bi062284r. Epub 2007 Aug 18. Biochemistry. 2007. PMID: 17705557
-
Ions and RNA folding.Annu Rev Biophys Biomol Struct. 2005;34:221-43. doi: 10.1146/annurev.biophys.34.040204.144511. Annu Rev Biophys Biomol Struct. 2005. PMID: 15869389 Review.
-
How RNA folds.J Mol Biol. 1999 Oct 22;293(2):271-81. doi: 10.1006/jmbi.1999.3001. J Mol Biol. 1999. PMID: 10550208 Review.
Cited by
-
Generalized Manning Condensation Model Captures the RNA Ion Atmosphere.Phys Rev Lett. 2015 Jun 26;114(25):258105. doi: 10.1103/PhysRevLett.114.258105. Epub 2015 Jun 26. Phys Rev Lett. 2015. PMID: 26197147 Free PMC article.
-
Structural and dynamic mechanisms for coupled folding and tRNA recognition of a translational T-box riboswitch.Nat Commun. 2023 Nov 15;14(1):7394. doi: 10.1038/s41467-023-43232-z. Nat Commun. 2023. PMID: 37968328 Free PMC article.
-
Why Does RNA Collapse? The Importance of Water in a Simulation Study of Helix-Junction-Helix Systems.J Am Chem Soc. 2018 Dec 12;140(49):16948-16951. doi: 10.1021/jacs.8b11111. Epub 2018 Nov 29. J Am Chem Soc. 2018. PMID: 30465606 Free PMC article.
-
Riboswitch conformations revealed by small-angle X-ray scattering.Methods Mol Biol. 2009;540:141-59. doi: 10.1007/978-1-59745-558-9_11. Methods Mol Biol. 2009. PMID: 19381558 Free PMC article.
-
Understanding nucleic acid-ion interactions.Annu Rev Biochem. 2014;83:813-41. doi: 10.1146/annurev-biochem-060409-092720. Epub 2014 Mar 5. Annu Rev Biochem. 2014. PMID: 24606136 Free PMC article. Review.
References
-
- Stein A, Crothers DM. Biochemistry. 1976;15:160–167. - PubMed
-
- Römer R, Hach R. Eur J Biochem. 1975;55:271–284. - PubMed
-
- Misra VK, Draper DE. J Mol Biol. 2002;317:507–521. - PubMed
-
- Fang X, Littrell K, Yang XJ, Henderson SJ, Siefert S, Thiyagarajan P, Pan T, Sosnick TR. Biochemistry. 2000;39:11107–11113. - PubMed
Publication types
MeSH terms
Substances
Grants and funding
LinkOut - more resources
Full Text Sources
Other Literature Sources
