

Structure determination of a membrane protein with two trans-membrane helices in aligned phospholipid bicelles by solid-state NMR spectroscopy
- PMID: 16967977
- PMCID: PMC3236029
- DOI: 10.1021/ja063640w
Structure determination of a membrane protein with two trans-membrane helices in aligned phospholipid bicelles by solid-state NMR spectroscopy
Abstract
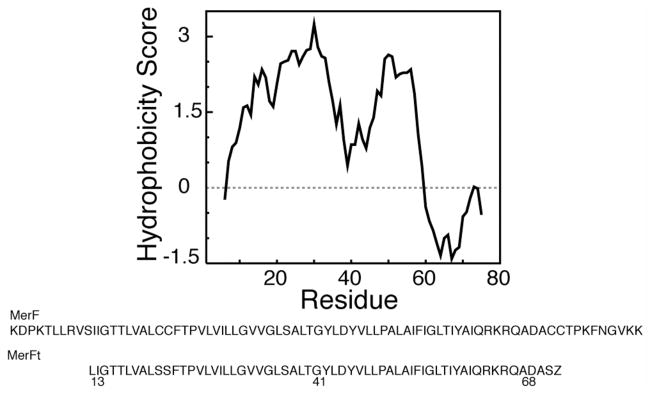
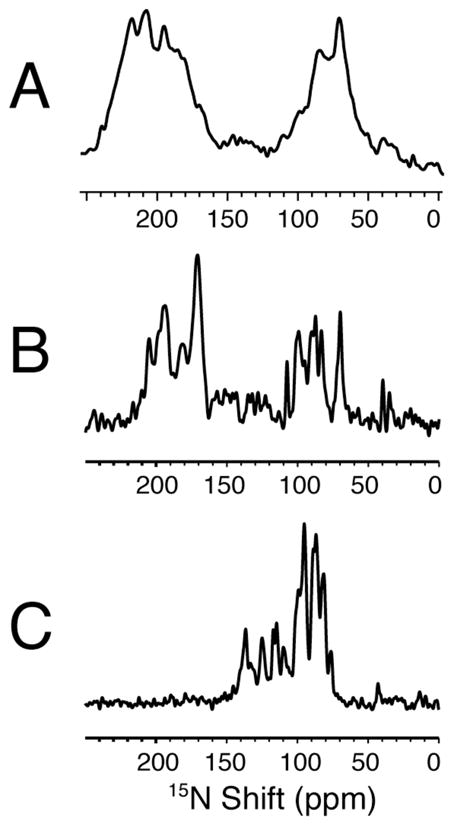
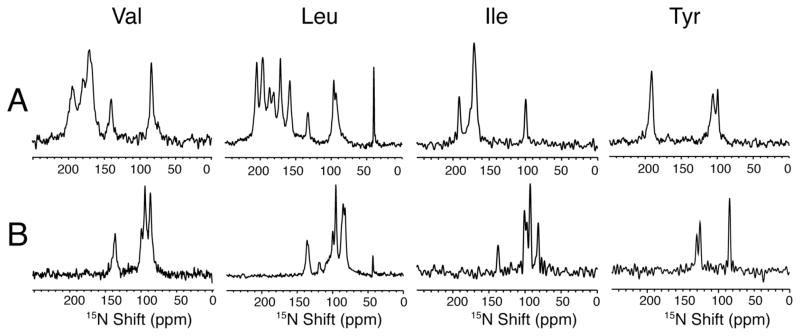
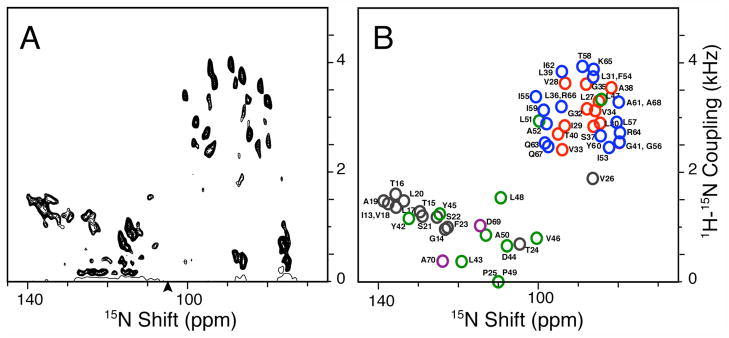
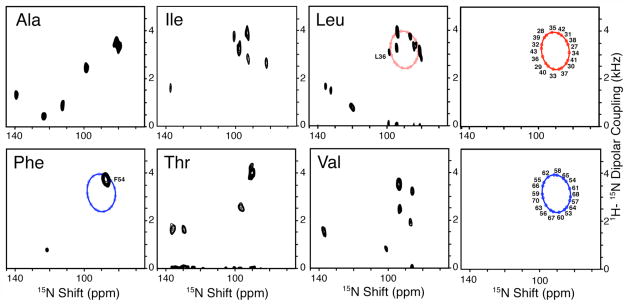
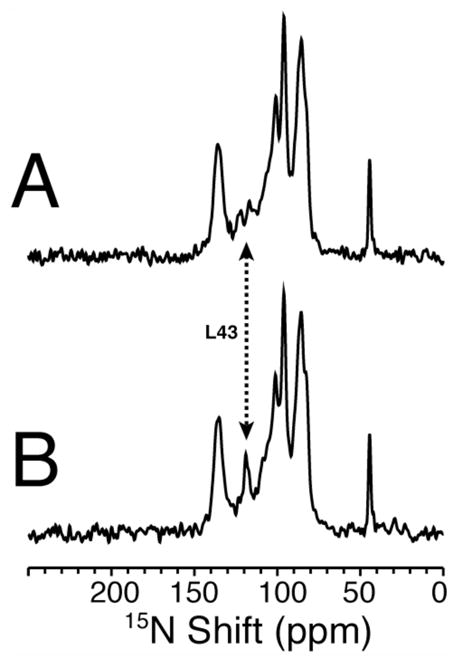
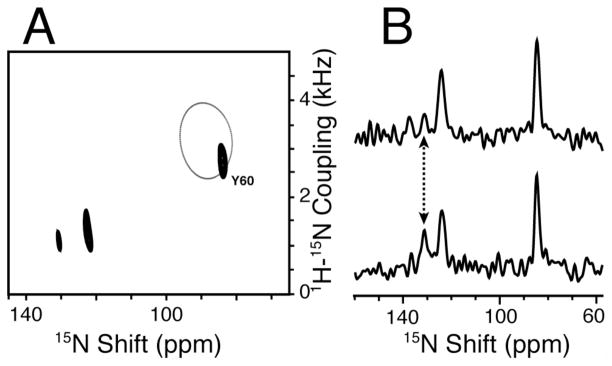
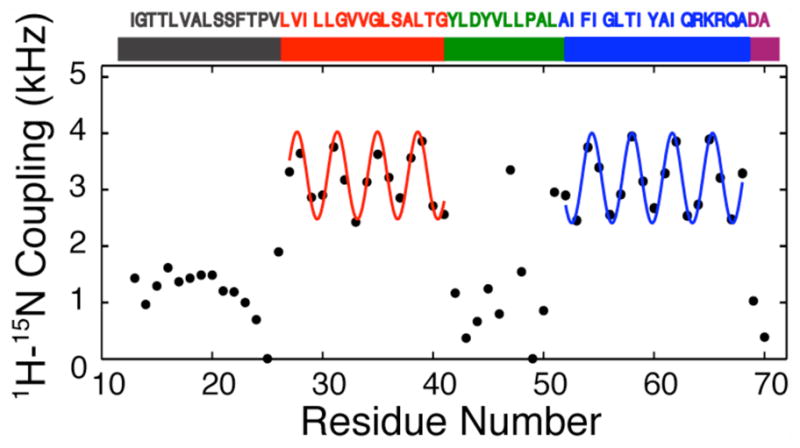
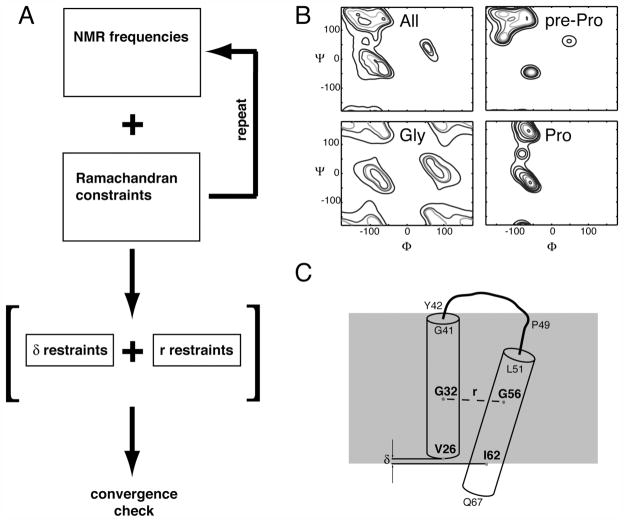
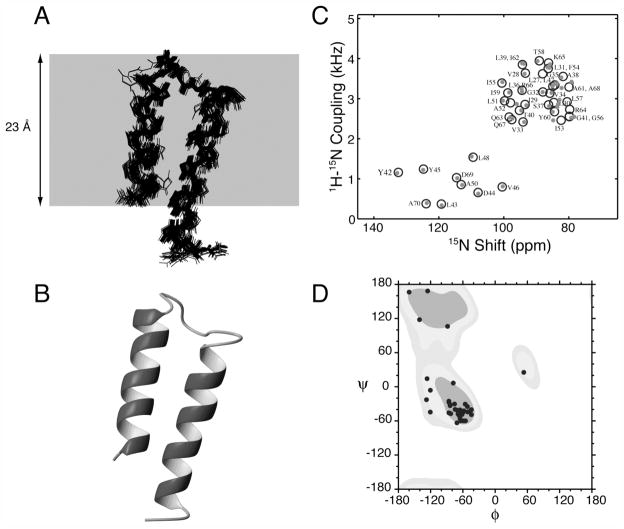
The structure of the membrane protein MerFt was determined in magnetically aligned phospholipid bicelles by solid-state NMR spectroscopy. With two trans-membrane helices and a 10-residue inter-helical loop, this truncated construct of the mercury transport membrane protein MerF has sufficient structural complexity to demonstrate the feasibility of determining the structures of polytopic membrane proteins in their native phospholipid bilayer environment under physiological conditions. PISEMA, SAMMY, and other double-resonance experiments were applied to uniformly and selectively (15)N-labeled samples to resolve and assign the backbone amide resonances and to measure the associated (15)N chemical shift and (1)H-(15)N heteronuclear dipolar coupling frequencies as orientation constraints for structure calculations. (1)H/(13)C/(15)N triple-resonance experiments were applied to selectively (13)C'- and (15)N-labeled samples to complete the resonance assignments, especially for residues in the nonhelical regions of the protein. A single resonance is observed for each labeled site in one- and two-dimensional spectra. Therefore, each residue has a unique conformation, and all protein molecules in the sample have the same three-dimensional structure and are oriented identically in planar phospholipid bilayers. Combined with the absence of significant intensity near the isotropic resonance frequency, this demonstrates that the entire protein, including the loop and terminal regions, has a well-defined, stable structure in phospholipid bilayers.
Figures
Similar articles
-
Resonance assignments of a membrane protein in phospholipid bilayers by combining multiple strategies of oriented sample solid-state NMR.J Biomol NMR. 2014 Jan;58(1):69-81. doi: 10.1007/s10858-013-9806-y. Epub 2013 Dec 20. J Biomol NMR. 2014. PMID: 24356892 Free PMC article.
-
Three-dimensional structure of the transmembrane domain of Vpu from HIV-1 in aligned phospholipid bicelles.Biophys J. 2006 Oct 15;91(8):3032-42. doi: 10.1529/biophysj.106.087106. Epub 2006 Jul 21. Biophys J. 2006. PMID: 16861273 Free PMC article.
-
A general assignment method for oriented sample (OS) solid-state NMR of proteins based on the correlation of resonances through heteronuclear dipolar couplings in samples aligned parallel and perpendicular to the magnetic field.J Magn Reson. 2011 Apr;209(2):195-206. doi: 10.1016/j.jmr.2011.01.008. Epub 2011 Jan 21. J Magn Reson. 2011. PMID: 21316275 Free PMC article.
-
Structure determination of membrane proteins by NMR spectroscopy.Biochem Cell Biol. 2002;80(5):597-604. doi: 10.1139/o02-154. Biochem Cell Biol. 2002. PMID: 12440700 Free PMC article. Review.
-
Lipid bilayers: an essential environment for the understanding of membrane proteins.Magn Reson Chem. 2007 Dec;45 Suppl 1:S2-11. doi: 10.1002/mrc.2077. Epub 2007 Dec 19. Magn Reson Chem. 2007. PMID: 18095258 Review.
Cited by
-
Resonance assignments of a membrane protein in phospholipid bilayers by combining multiple strategies of oriented sample solid-state NMR.J Biomol NMR. 2014 Jan;58(1):69-81. doi: 10.1007/s10858-013-9806-y. Epub 2013 Dec 20. J Biomol NMR. 2014. PMID: 24356892 Free PMC article.
-
Control of Transmembrane Helix Dynamics by Interfacial Tryptophan Residues.Biophys J. 2018 Jun 5;114(11):2617-2629. doi: 10.1016/j.bpj.2018.04.016. Biophys J. 2018. PMID: 29874612 Free PMC article.
-
Assignment of oriented sample NMR resonances from a three transmembrane helix protein.J Magn Reson. 2014 Mar;240:34-44. doi: 10.1016/j.jmr.2013.12.014. Epub 2014 Jan 21. J Magn Reson. 2014. PMID: 24509383 Free PMC article.
-
Combination of ¹⁵N reverse labeling and afterglow spectroscopy for assigning membrane protein spectra by magic-angle-spinning solid-state NMR: application to the multidrug resistance protein EmrE.J Biomol NMR. 2013 Apr;55(4):391-9. doi: 10.1007/s10858-013-9724-z. Epub 2013 Mar 29. J Biomol NMR. 2013. PMID: 23539118 Free PMC article.
-
Structure determination of membrane proteins by nuclear magnetic resonance spectroscopy.Annu Rev Anal Chem (Palo Alto Calif). 2013;6:305-28. doi: 10.1146/annurev-anchem-062012-092631. Epub 2013 Apr 1. Annu Rev Anal Chem (Palo Alto Calif). 2013. PMID: 23577669 Free PMC article. Review.
References
Publication types
MeSH terms
Substances
Grants and funding
LinkOut - more resources
Full Text Sources
Other Literature Sources
