. 2006 Sep;3(10):e401.
doi: 10.1371/journal.pmed.0030401.

Empirical evidence for the effect of airline travel on inter-regional influenza spread in the United States

Affiliations

Empirical evidence for the effect of airline travel on inter-regional influenza spread in the United States

John S Brownstein et al. PLoS Med. 2006 Sep.

Abstract

Background: The influence of air travel on influenza spread has been the subject of numerous investigations using simulation, but very little empirical evidence has been provided. Understanding the role of airline travel in large-scale influenza spread is especially important given the mounting threat of an influenza pandemic. Several recent simulation studies have concluded that air travel restrictions may not have a significant impact on the course of a pandemic. Here, we assess, with empirical data, the role of airline volume on the yearly inter-regional spread of influenza in the United States.

Methods and findings: We measured rate of inter-regional spread and timing of influenza in the United States for nine seasons, from 1996 to 2005 using weekly influenza and pneumonia mortality from the Centers for Disease Control and Prevention. Seasonality was characterized by band-pass filtering. We found that domestic airline travel volume in November (mostly surrounding the Thanksgiving holiday) predicts the rate of influenza spread (r(2) = 0.60; p = 0.014). We also found that international airline travel influences the timing of influenza mortality (r(2) = 0.59; p = 0.016). The flight ban in the US after the terrorist attack on September 11, 2001, and the subsequent depression of the air travel market, provided a natural experiment for the evaluation of flight restrictions; the decrease in air travel was associated with a delayed and prolonged influenza season.

Conclusions: We provide the first empirical evidence for the role of airline travel in long-range dissemination of influenza. Our results suggest an important influence of international air travel on the timing of influenza introduction, as well as an influence of domestic air travel on the rate of inter-regional influenza spread in the US. Pandemic preparedness strategies should account for a possible benefit of airline travel restrictions on influenza spread.


Conflict of interest statement

Competing Interests: The authors have declared that no competing interests exist.

Figures

Figure 1
Figure 1. Filtering of Weekly P&I Mortality in the United States (1996–2005)
(A) The black line represents the aggregated national data of P&I weekly mortality. The blue line represents the seasonal influenza curve, derived by band-pass filtering the demeaned data (two-pole, two-pass Butterworth, 1/64–1/40 frequency range). For comparison with the raw data, the mean is added after filtering. The filtered time series plus mean accounts for 99.8% of the mortality, indicating that most deaths are from the mean and seasonal variation and not the high-frequency cycles. (B) Lines represent the raw time series data for each of the nine geographic regions of the US. (C) Lines represent the seasonal influenza curves for each of the nine geographic regions of the US, derived by band-pass filtering.
Figure 2
Figure 2. Major Geographic Regions of the United States
The sentinel cities that report mortality due to P&I used in the Centers for Disease Control and Prevention 122 Cities Mortality Reporting System are displayed (black dots). Because the strength of the seasonal influenza cycle is weak for cities with small case counts and because some city data contain missing data points, we aggregated the raw city-level data to obtain composite waveforms by major geographic region, the aerial unit of analysis for this study.
Figure 3
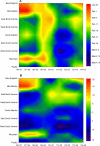
Figure 3. Timing of Influenza Illness across the Nine Major Geographic Regions of the United States (1996–2005)
For each influenza year, phase shifts are calculated as the maximum value from cross-correlation of the band-pass filtered weekly P&I mortality data. (A) Contour plot of raw phase shifts between regions for each season, which displays shifts in the absolute timing of influenza mortality peaks from year to year. The plot shows the shifts in the yearly phase, with the 1999–2000 season exhibiting an overall earlier peak and the 2001–2002 season (following September 11, 2001) exhibiting an overall later peak across all regions. (B) Contour plot of demeaned phase shifts, which displays typical regional patterns and relative time to transnational spread. For each season, demeaned phase shifts were calculated by subtracting the mean peak date. The plot reveals increased variation in phase shifts (time to transnational spread) during the earliest influenza seasons, 1996–1997 and 1997–1998, as well as the increased variation during the 2001–2002 influenza season.
Figure 4
Figure 4. Influence of United States Airline Volume on Influenza Spread and the Timing of Yearly Transmission
(A) November domestic air travel volume (red line) is estimated by the total number of passengers on domestic flights. Duration to transnational spread of influenza (blue line) is estimated as the 99% confidence intervals for differences between the estimated seasonal curves of influenza mortality for each of nine major geographic regions of the United States. (B) The association between domestic airline travel in November and transnational spread is displayed. The numbers of traveling domestic passengers in November significantly predicts transnational influenza spread (f = 10.6; r  2 = 0.60; slope = −0.94 days/million passengers; p = 0.014). (C) September international air travel volume (red line) is estimated by the total number of passengers on international flights. The timing of seasonal national influenza mortality (blue line) is estimated as the peak date of influenza mortality from the filtered national curve. The timing displayed is relative to the average date of February 17. (D) The association between international airline travel in September and the timing of the US influenza peak is displayed. The numbers of traveling international passengers in September significantly predicts the timing of seasonal influenza mortality (f = 10.0; r  2 = 0.59; slope = −11.3 days/million passengers; p = 0.016).

Comment in

References

    1. Grais RF, Ellis JH, Kress A, Glass GE. Modeling the spread of annual influenza epidemics in the U.S.: The potential role of air travel. Health Care Manag Sci. 2004;7:127–134. - PubMed
    1. Longini IM, Jr, Fine PE, Thacker SB. Predicting the global spread of new infectious agents. Am J Epidemiol. 1986;123:383–391. - PubMed
    1. Rvachev L, Longini I. A mathematical model for the global spread of influenza. Math Biosci. 1985;75:3–22.
    1. Flahault A, Deguen S, Valleron AJ. A mathematical model for the European spread of influenza. Eur J Epidemiol. 1994;10:471–474. - PubMed
    1. Grais RF, Ellis JH, Glass GE. Assessing the impact of airline travel on the geographic spread of pandemic influenza. Eur J Epidemiol. 2003;18:1065–1072. - PubMed

Publication types