. 2006 Oct;4(10):e312.
doi: 10.1371/journal.pbio.0040312.

Predicting essential components of signal transduction networks: a dynamic model of guard cell abscisic acid signaling

Affiliations

Predicting essential components of signal transduction networks: a dynamic model of guard cell abscisic acid signaling

Song Li et al. PLoS Biol. 2006 Oct.

Abstract

Plants both lose water and take in carbon dioxide through microscopic stomatal pores, each of which is regulated by a surrounding pair of guard cells. During drought, the plant hormone abscisic acid (ABA) inhibits stomatal opening and promotes stomatal closure, thereby promoting water conservation. Dozens of cellular components have been identified to function in ABA regulation of guard cell volume and thus of stomatal aperture, but a dynamic description is still not available for this complex process. Here we synthesize experimental results into a consistent guard cell signal transduction network for ABA-induced stomatal closure, and develop a dynamic model of this process. Our model captures the regulation of more than 40 identified network components, and accords well with previous experimental results at both the pathway and whole-cell physiological level. By simulating gene disruptions and pharmacological interventions we find that the network is robust against a significant fraction of possible perturbations. Our analysis reveals the novel predictions that the disruption of membrane depolarizability, anion efflux, actin cytoskeleton reorganization, cytosolic pH increase, the phosphatidic acid pathway, or K(+) efflux through slowly activating K(+) channels at the plasma membrane lead to the strongest reduction in ABA responsiveness. Initial experimental analysis assessing ABA-induced stomatal closure in the presence of cytosolic pH clamp imposed by the weak acid butyrate is consistent with model prediction. Simulations of stomatal response as derived from our model provide an efficient tool for the identification of candidate manipulations that have the best chance of conferring increased drought stress tolerance and for the prioritization of future wet bench analyses. Our method can be readily applied to other biological signaling networks to identify key regulatory components in systems where quantitative information is limited.


Conflict of interest statement

Competing interests. The authors have declared that no competing interests exist.

Figures

Figure 1
Figure 1. Illustration of the Inference Rules Used in Network Reconstruction
(1) If A → B and C → process (A → B), where A → B is not a biochemical reaction such as an enzyme catalyzed reaction or protein-protein/small molecule interaction, we assume that C is acting on an intermediary node (IN) of the A–B pathway. (2) If A → B, A → C, and C → process (A → B), where A → B is not a direct interaction, the most parsimonious explanation is that C is a member of the A–B pathway, i.e. A → C → B. (3) If A —| B and C —| process (A —| B), where A —| B is not a direct interaction, we assume that C is inhibiting an intermediary node (IN) of the A–B pathway. Note that A→ IN —| B is the only logically consistent representation of the A–B pathway.
Figure 2
Figure 2. Current Knowledge of Guard Cell ABA Signaling
The color of the nodes represents their function: enzymes are shown in red, signal transduction proteins are green, membrane transport–related nodes are blue, and secondary messengers and small molecules are orange. Small black filled circles represent putative intermediary nodes mediating indirect regulatory interactions. Arrowheads represent activation, and short perpendicular bars indicate inhibition. Light blue lines denote interactions derived from species other than Arabidopsis; dashed light-blue lines denote inferred negative feedback loops on pHc and S1P. Nodes involved in the same metabolic pathway or protein complex are bordered by a gray box; only those arrows that point into or out of the box signify information flow (signal transduction). The full names of network components corresponding to each abbreviated node label are: ABA, abscisic acid; ABI1/2, protein phosphatase 2C ABI1/2; ABH1, mRNA cap binding protein; Actin, actin cytoskeleton reorganization; ADPRc, ADP ribose cyclase; AGB1, heterotrimeric G protein β component; AnionEM, anion efflux at the plasma membrane; Arg, arginine; AtPP2C, protein phosphatase 2C; Atrboh, NADPH oxidase; CaIM, Ca2+ influx across the plasma membrane; Ca2+ ATPase, Ca2+ ATPases and Ca2+/H+ antiporters responsible for Ca2+ efflux from the cytosol; Ca2+ c, cytosolic Ca2+ increase; cADPR, cyclic ADP-ribose; cGMP, cyclic GMP; CIS, Ca2+ influx to the cytosol from intracellular stores; DAG, diacylglycerol; Depolar, plasma membrane depolarization; ERA1, farnesyl transferase ERA1; GC, guanyl cyclase; GCR1, putative G protein–coupled receptor; GPA1, heterotrimeric G protein α subunit; GTP, guanosine 5′-triphosphate; H+ ATPase, H+ ATPase at the plasma membrane; InsPK, inositol polyphosphate kinase; InsP3, inositol-1,4,5-trisphosphate; InsP6, inositol hexakisphosphate; KAP, K+ efflux through rapidly activating K+ channels (AP channels) at the plasma membrane; KEV, K+ efflux from the vacuole to the cytosol; KOUT, K+ efflux through slowly activating outwardly-rectifying K+ channels at the plasma membrane; NAD+, nicotinamide adenine dinucleotide; NADPH, nicotinamide adenine dinucleotide phosphate; NOS, Nitric oxide synthase; NIA12, Nitrate reductase; NO, Nitric oxide; OST1, protein kinase open stomata 1; PA, phosphatidic acid; PC, phosphatidyl choline; PEPC, phosphoenolpyruvate carboxylase; PIP2, phosphatidylinositol 4,5-bisphosphate; PLC, phospholipase C; PLD, phospholipase D; RAC1, small GTPase RAC1; RCN1, protein phosphatase 2A; ROP2, small GTPase ROP2; ROP10, small GTPase ROP10; ROS, reactive oxygen species; SphK, sphingosine kinase; S1P, sphingosine-1-phosphate.
Figure 3
Figure 3. Stomatal Aperture Distributions without ABA Treatment (gray bars) and with 50 μM ABA (white bars)
(A) The x axis gives the stomatal aperture size and the y axis indicates the fraction of stomata for which that aperture size was observed. The black columns indicate the overlap between the 0 μM ABA and the 50 μM ABA distributions. (B) Classical bar plot representation of stomatal aperture for treatment with 50 μM ABA (white bar, labeled 1) and without ABA treatment (gray bar, labeled 2) using mean ± standard error. This representation provides minimal information on population structure.
Figure 4
Figure 4. Schematic Illustration of Our Modeling Methodology and of the Probability of Closure
In this four-node network example, node A is the input (as ABA is the input of the ABA signal transduction network), and node D is the output (corresponding to the node “Closure” in the ABA signal transduction network). The nodes' states are indicated by the shading of their symbols: open symbols represent the off (0) state and filled symbols signify the on (1) state. To indicate the connection between this example and ABA-induced closure, we associate D = off (0) with a picture of an open stomate, and D = on (1) with a picture of a closed stomate. The Boolean transfer functions of this network are A* = 1, B* = A, C* = A, D* = B and C (i.e., node A is on commencing immediately after the initial condition, the next states of nodes B and C are determined by A, and D is on only when both B and C are on). (A) The first column represents the networks' initial states; the input and output are not on, but some of the components in the network are randomly activated (e.g., middle row, node B). The input node A turns on right after initialization, signifying the initiation of the ABA signal. The next three columns in (A) represent the network's intermediary states during a sequential update of the nodes B, C, and D, where the updated node is given as a gray label above the gray arrow corresponding to the state transition. This sequence of three transitions represents a round of updates from timestep 1 (second column) to timestep 2 (last column). Out of a total of 22 × 3! = 24 possible different normal responses, two sketches of normal responses are shown in the top two rows. The bottom row illustrates a case in which one node (shown as a square) is disrupted (knocked out) and cannot be regulated or regulate downstream nodes (indicated as dashed edges). (B) The probability of closure indicates the fraction of simulations where the output D = 1 is reached in each timestep; thus, in this illustration the probability of closure for the normal response (circles) increases from 0% at time step 1 to 100% at timestep 2. The knockout mutant's probability of closure (squares) is 0% at both time steps.
Figure 5
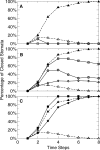
Figure 5. The Probability of ABA-Induced Closure (i.e., the Percentage of Simulations that Attain Closure) as a Function of Timesteps in the Dynamic Model
In all panels, black triangles with dashed lines represent the normal (wild-type) response to ABA stimulus. Open triangles with dashed lines show that in wild-type, the probability of closure decays in the absence of ABA. (A) Perturbations in depolarization (open diamonds) or anion efflux at the plasma membrane (open squares) cause total loss of ABA-induced closure. The effect of disrupting actin reorganization (not shown) is identical to the effect of blocking anion efflux. (B) Perturbations in S1P (dashed squares), PA (dashed circles), or pHc (dashed diamonds) lead to reduced closure probability. The effect of disrupting SphK is nearly identical to the effect of disrupting S1P (dashed squares); perturbations in GPA1 and PLD, KOUT are very close to perturbations in PA (dashed circles); for clarity, these curves are not shown in the plot. (C) abi1 recessive mutants (black squares) show faster than wild-type ABA-induced closure (ABA hypersensitivity). The effect of blocking Ca2+ ATPase(s) (not shown) is very similar to the effect of the abi1 mutation. Blocking Ca2+ c increase (black diamonds) causes slower than wild-type ABA-induced closure (ABA hyposensitivity). The effect of disrupting atrboh or ROS production (not shown) is very similar to the effect of blocking Ca2+ c increase.
Figure 6
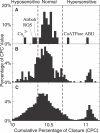
Figure 6. Classification of Close-to-Normal Responses
(A) For all the single mutants that ultimately reach 100% closure, we plot the histogram of the cumulative probability of closure (CPC). We find three distinct types of responses: hypersensitivity (CPC > 10.7, for abi1 and Ca2+ ATPase disruption); hyposensitivity (CPC < 10.35, for Ca2+ c , atrboh, and ROS disruption); and normal responses ( 10.35 < CPC < 10.7). For all the double (B) and triple (C) mutants that eventually reach 100% closure at steady state when ABA = 1, we classify the responses using the CPC thresholds defined by the single mutant responses. The CPC threshold values are indicated by dashed vertical lines in the plot.
Figure 7
Figure 7. Summary of the Dynamic Effects of Calcium Disruptions
All curves represent the probability of ABA-induced closure (i.e., the percentage of simulations that attain closure) as a function of time steps. Black triangles with dashed line represent the normal (wild-type) response to ABA stimulus; open triangles with dashed lines show how the probability of closure decays in the absence of ABA. CIS + PA double mutants (dashed circles) and Ca2+ c + pHc double mutants (dashed diamonds) show insensitivity to ABA. Ca2+ ATPase + RCN1 double mutants (black circles) show hyposensitive (delayed) response to ABA. Guanyl cyclase + CIS + CaIM triple mutants (black diamonds) also show hyposensitivity; note that none of the guanyl cyclase or CIS or CaIM single knockouts show changed sensitivity (data not shown). Ca2+ ATPase mutants (black squares) show faster than wild-type ABA-induced closure (ABA hypersensitivity).
Figure 8
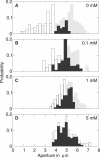
Figure 8. Effect of Cytosolic pH Clamp (Increasing Concentrations of Na-butyrate from 0 to 5 mM) on ABA-Induced Stomatal Closure
The histograms show the distribution of stomatal apertures without ABA treatment (gray bars) and with 50 μM ABA (white bars). Throughout, the x-axis gives the stomatal aperture size and the y-axis indicates the fraction of stomata for which that aperture size was observed. The black columns indicate the overlap between the 0 μM ABA and the 50 μM ABA distributions. Note that the data of (A) and those of Figure 3A are identical; these data are reproduced here for ease of comparison with panels (B–D).

Comment in

Similar articles

Cited by

References

    1. Fall CP, Marland ES, Wagner JM, Tyson JJ. Computational cell biology. New York: Springer; 2002. 468
    1. Voit EO. Computational analysis of biochemical systems. Cambridge: Cambridge University Press; 2000. 531
    1. Bower JM, Bolouri H. Computational modeling of genetic and biochemical networks. Cambridge (Massachusetts): MIT Press; 2001. 336
    1. Uetz P, Giot L, Cagney G, Mansfield TA, Judson RS, et al. A comprehensive analysis of protein-protein interactions in Saccharomyces cerevisiae . Nature. 2000;403:623–627. - PubMed
    1. Li S, Armstrong CM, Bertin N, Ge H, Milstein S, et al. A map of the interactome network of the metazoan C. elegans . Science. 2004;303:540–543. - PMC - PubMed

Publication types