. 2006 Oct;4(10):e313.
doi: 10.1371/journal.pbio.0040313.

Threshold-dependent BMP-mediated repression: a model for a conserved mechanism that patterns the neuroectoderm

Affiliations

Threshold-dependent BMP-mediated repression: a model for a conserved mechanism that patterns the neuroectoderm

Claudia Mieko Mizutani et al. PLoS Biol. 2006 Oct.

Abstract

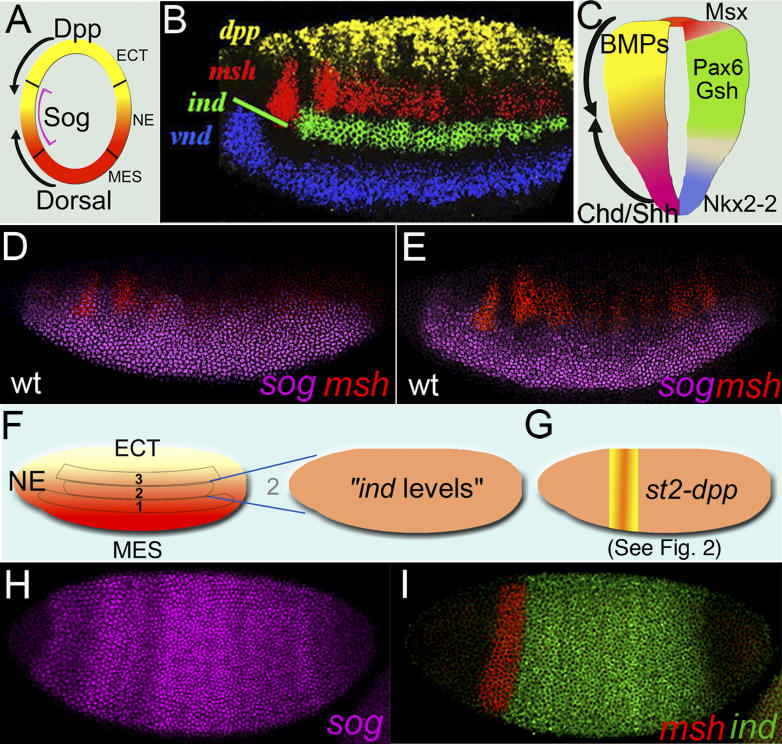
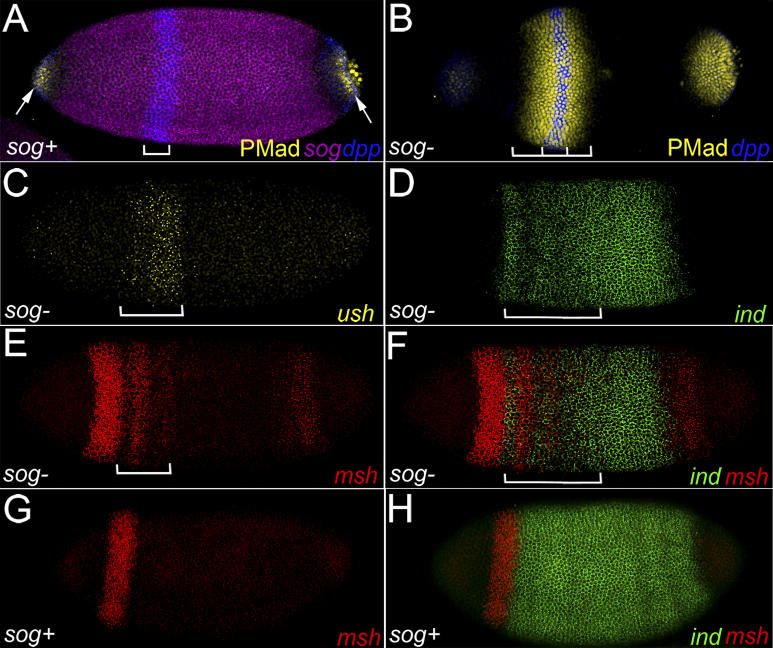
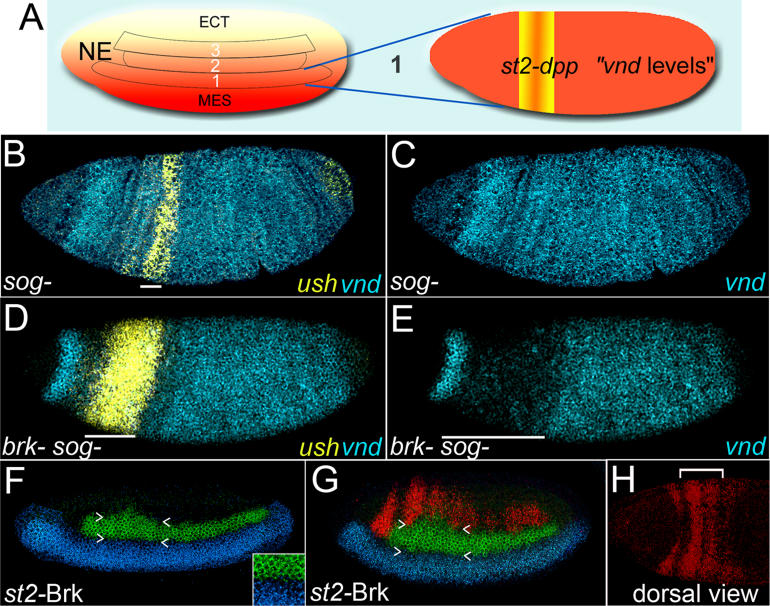
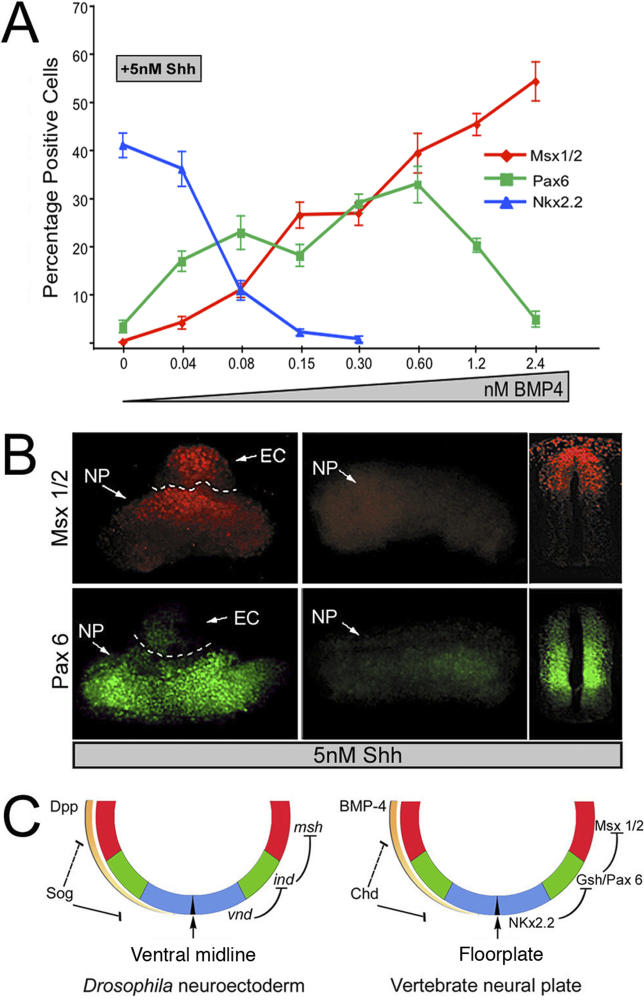
Subdivision of the neuroectoderm into three rows of cells along the dorsal-ventral axis by neural identity genes is a highly conserved developmental process. While neural identity genes are expressed in remarkably similar patterns in vertebrates and invertebrates, previous work suggests that these patterns may be regulated by distinct upstream genetic pathways. Here we ask whether a potential conserved source of positional information provided by the BMP signaling contributes to patterning the neuroectoderm. We have addressed this question in two ways: First, we asked whether BMPs can act as bona fide morphogens to pattern the Drosophila neuroectoderm in a dose-dependent fashion, and second, we examined whether BMPs might act in a similar fashion in patterning the vertebrate neuroectoderm. In this study, we show that graded BMP signaling participates in organizing the neural axis in Drosophila by repressing expression of neural identity genes in a threshold-dependent fashion. We also provide evidence for a similar organizing activity of BMP signaling in chick neural plate explants, which may operate by the same double negative mechanism that acts earlier during neural induction. We propose that BMPs played an ancestral role in patterning the metazoan neuroectoderm by threshold-dependent repression of neural identity genes.


Conflict of interest statement

Competing interests. The authors have declared that no competing interests exist.

Figures

Figure 1
Figure 1. A Conserved Pattern of Gene Expression in the Neuroectoderm
(A) Diagram indicating the relative positions of opposing BMP and Dorsal gradients in a transverse cross-section of a blastoderm stage Drosophila embryo. (B) Multiplex in situ staining of a Drosophila blastoderm stage embryo showing expression of vnd, ind, msh, and dpp along the DV axis. Dorsal is to the top and anterior to the left in this and subsequent figures. (C) Scheme indicating the relative expression domains of Nkx2.2, Gsh, Pax6, Msx1/2 as well as the BMP and Shh protein gradients in the vertebrate neural tube. (D and E) Dynamics of sog expression (purple) and msh expression (red). (D) In mid-blastoderm stage embryos, sog expression begins to fade from most dorsal cells of the neuroectoderm at the same time that msh expression is initiated as a partial stripe. (E) In slightly later embryos, the domains of sog and msh expression become nearly complementary. (F) Scheme for generating lateralized embryos with a uniform level of Dorsal adjusted to the level present in the mid-neuroectoderm (e.g. ind-expressing cells). These embryos were collected from females of the genotype gd 7 sog U2/gd 7 ; dl 1/+; Tl 3/+. (G) The same females were crossed to males carrying a homozygous insertion of an st2-dpp construct [75] to generate lateralized embryos expressing dpp in a stripe (see Figure 2). (H and I) Expression of neuroectodermal genes in lateralized embryos. (H) sog (purple). (I) ind (green) and msh (red). Note that the ring of msh expression directly abuts the domain of ind with no overlap and extends anteriorly beyond the domain of ind expression to approximately the same extent as observed in wild-type embryos (see [B]).
Figure 2
Figure 2. Threshold-Dependent Repression of ind and msh in Lateralized Embryos
(A) sog (purple), dpp (blue), and pMAD (yellow) expression in a lateralized embryo carrying st2-dpp. Note that there is no activation of pMAD in the central stripe of dpp expression. pMAD activation at the poles (arrows) serves as a positive control for the staining. (B) sog (absence of purple), dpp (blue), and pMAD (yellow) expression in a sog− lateralized embryo carrying st2-dpp. The domain of pMAD activation (long bracket) extends considerably beyond the narrow stripe of dpp expression (short bracket). (C–F). Expression of ush (yellow), ind (green), and msh (red) in a sog; st2-dpp lateralized embryo derived from gd 7 sog U2/gd 7 ; dl 1/+; Tl 3/+ mothers crossed to yw; st2-dpp males. (C) ush, which serves as a convenient marker for BMP activation, is induced in a domain (bracket) that is slightly broader than that of st2-dpp. (D) ind expression is repressed in a graded fashion along the AP axis extending approximately 20 cell diameters posterior to st2-dpp (bracket). (E) msh expression is activated in a pattern complementary to that of ind (bracket). This pattern exhibits modulation along the AP axis that is similar to the pattern of msh activation in wild-type embryos (see Figure 1D and 1E). (F) Merge of ind and msh expression patterns shown in (D and E) (bracket as in [D]). The restriction of msh expression to cells with very low levels of ind suggests that only modest levels of ind are necessary to repress msh expression. (G and H) Expression of ind (green), and msh (red) in a sog+; st2-dpp lateralized embryo. These embryos are siblings of the embryos described above in (C–F). ush expression is absent in this embryo. (G) msh expression is restricted to a narrow anterior stripe as it is in the absence of the st2-dpp element (compare with Figure 1H). (H) Merge of msh and ind expression showing that these gene expression domains are complementary (compare with Figure 1I).
Figure 3
Figure 3. BMP Signaling Can Also Repress Expression of vnd
(A) Scheme for generating ventro-lateralized embryos with a uniform level of Dorsal adjusted to that present in the ventral neuroectoderm (e.g., vnd expressing cells). These embryos were collected from gd 7 sog U2/gd 7 ; Tl 3/+ mothers (B and C) or sog Y506 brkm68/FM7; Tl r4/Tl r4 mothers (D and E). (B and C) ush (yellow) and vnd (cyan) expression in a sog; st2-dpp ventro-lateralized embryo. Note that while ush expression is induced in response to dpp expression in this embryo (bracket), the pattern of vnd expression remains unaffected. (D and E) ush (yellow) and vnd (cyan) expression in a brksog; st2-dpp ventro-lateralized embryo. (D) The level and width of ush expression (bracket) is greater than in sog− single mutants (compare with [B]). (E) Note the broad domain of reduced vnd expression (bracket), which extends anterior to the st2-dpp expression domain. (F−H) Expression of msh (red), ind (green), and vnd (blue) in a st2-brk embryo that has a normal Dorsal gradient. (F) A mid-blastoderm stage embryo showing shifts in the dorsal and ventral borders of ind expression. The inset shows higher magnification of the ind/vnd border in the region of st2-brk expression, which is consistently shifted dorsally by 1−2 cells within the stripe of brk expression. This shift is most clearly revealed by a consistent flattening of what is normally a continuous arc in the ind/vnd border at the position of st2-brk expression. The inset also shows that vnd expression extends up to the ind border and that there is no gap between these gene expression domains. We quantitated the shift in the ind/vnd border in nine st2-brk and nine wild-type embryos by counting the number of ind negative cells above a line spanning the ventral border of ind expression in the head and abdomen comprising a zone four cells wide centered within the st2 domain (or its approximate corresponding position in wild-type embryos). ind is better than vnd for performing this measurement since the ventral ind border is sharper (i.e., more all-or-none) than the dorsal vnd border. This analysis reveals that in st2-brk embryos there is an average of 5.4 ± 2.65 ind negative (vnd positive) cells above the line (which corresponds to an average shift of the ind/vnd border of 5.4/4 = 1.35 cells dorsally). In contrast, for control wild-type embryos we counted an average of 0.44 ± 0.88 cells above the line corresponding to an average of 0.11 cells. This represents a 10-fold difference between wild-type and st2-brk embryos, which is highly significant in a students' t-test (p < 0.0003). (G) Lateral view of a slightly older embryo than that shown in (F) showing a significant dorsal shift of the msh/ind border and a smaller shift of the ind/vnd border. The carets in (F and G) indicate the approximate trajectories of the ind/vnd and msh/ind borders in wild-type embryos. (H) Dorsal view of the same embryo shown in (G) revealing that msh expression expands to the dorsal midline.
Figure 4
Figure 4. Dose-Dependent BMP-Mediated Repression in Neural Plate Explants
(A) Chick intermediate neural plate explants were grown in 5 nM Shh and a range of BMP4 from 0 nM to 2.4 nM. Cells were stained with antibodies for Nkx2.2, Pax6, or Msx1/2 and number of positive cells per explant was counted and the percentage of positive cells was calculated and graphed. Error bars indicate standard error of the mean. The number of explants assayed was as follows, starting at 0 nM and ending at 2.4 nM BMP4: Nkx2.2 (25, 12, 15, 18, 12), Pax6 (18, 6, 18, 24, 30, 12, 24, 28), and Msx1/2 (12, 6, 16, 11, 17, 11, 17, 17). (B) Intermediate chick neural plate explants (NP) with (left) or without (right) BMP-expressing non-neural ectodermal tissue (EC) placed on the top edge, and cultured in the presence of 5 nM Shh. The fraction of Msx1/2-expressing cells is highest near the BMP source (top, left), and diminishes as a function of distance from the ectoderm. In a separate neural plate/ectoderm co-culture (bottom, left), Pax6 is expressed at a greater distance from the ectoderm, but not in nearby neural plate cells, which presumably express Msx1/2. These results mimic the relative expression domains of Msx1/2 and Pax6 in a stage 20 chick neural tube (far right). (C) Simplified summary model indicating the proposed similarities in BMP-mediated patterning of the vertebrate and invertebrate neuroectoderm. Two processes collaborate to establish the pattern of neural identity gene expression in Drosophila and vertebrates: graded BMP signaling preferentially represses expression of ventral neural identity genes (left), which then engage in a chain of ventral-dominant repression wherein more ventral genes prevail in repressing the expression of more dorsal genes (right). The indicated inhibition of Msx1/2 by Pax6 remains hypothetical. Not indicated on this scheme are additional levels of cross-inhibition (e.g., Vnd inhibition of msh, late Ind repression of vnd, and Pax6 repression of Nkx2.2) [9,10,16,21,61,62], which are likely to help sharpen and refine the pattern created by the core mechanism of threshold-dependent BMP repression coupled to ventral dominance.

Comment in

References

    1. Freeman M, Gurdon JB. Regulatory principles of developmental signaling. Annu Rev Cell Dev Biol. 2002;18:515–539. - PubMed
    1. Tabata T, Takei Y. Morphogens, their identification and regulation. Development. 2004;131:703–712. - PubMed
    1. Bier E. Anti-neural-inhibition: A conserved mechanism for neural induction. Cell. 1997;89:681–684. - PubMed
    1. Eldar A, Dorfman R, Weiss D, Ashe H, Shilo BZ, et al. Robustness of the BMP morphogen gradient in Drosophila embryonic patterning. Nature. 2002;419:304–308. - PubMed
    1. Shimmi O, Umulis D, Othmer H, O'Connor MB. Facilitated transport of a Dpp/Scw heterodimer by Sog/Tsg leads to robust patterning of the Drosophila blastoderm embryo. Cell. 2005;120:873–886. - PMC - PubMed

Publication types

LinkOut - more resources