. 2006 Sep 19;103(38):14134-9.
doi: 10.1073/pnas.0604568103. Epub 2006 Sep 12.

Hedgehog modulates cell cycle regulators in stem cells to control hematopoietic regeneration

Affiliations

Hedgehog modulates cell cycle regulators in stem cells to control hematopoietic regeneration

Jennifer J Trowbridge et al. Proc Natl Acad Sci U S A. .

Abstract

The signals that control the regenerative ability of hematopoietic stem cells (HSCs) in response to damage are unknown. Here, we demonstrate that downstream activation of the Hedgehog (Hh) signaling pathway induces cycling and expansion of primitive bone marrow hematopoietic cells under homeostatic conditions and during acute regeneration. However, this effect is at the expense of HSC function, because continued Hh activation during regeneration represses expression of specific cell cycle regulators, leading to HSC exhaustion. In vivo treatment with an inhibitor of the Hh pathway rescues these transcriptional and functional defects in HSCs. Our study establishes Hh signaling as a regulator of the HSC cell cycle machinery that balances hematopoietic homeostasis and regeneration in vivo.


Conflict of interest statement

The authors declare no conflict of interest.

Figures
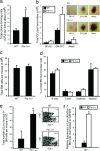
Fig. 1.
Fig. 1.
Hh activation expands primitive BM hematopoietic cells. (a) Total number of hematopoietic progenitors (CFU) per femur plus tibia of individual WT or ptc-1+/− mice (n = 6 mice per genotype). (b) Total number of CFU progenitor subtypes per femur plus tibia of individual WT or ptc-1+/− mice (n = 6). Representative pictures of colony subtypes are shown. (c) Total number of BM mononuclear cells isolated per WT or ptc-1+/− mouse (n = 7). (d) Multilineage composition of WT and ptc-1+/− BM mononuclear cells, analyzed for expression of B cell (CD45+B220+), T cell (CD45+CD3+), erythroid (CD45-Ter119+), and myeloid (CD45+CD11b+) surface markers (n = 5). (e) Total number of LSK BM cells per WT or ptc-1+/− mouse (n = 5). Representative flow cytometric analysis of c-Kit and Sca-1 expression is shown. (f) Relative expression of Gli-1 in WT and ptc-1+/− LSK BM cells (n = 2 mice per genotype). ∗, P < 0.05.
Fig. 2.
Fig. 2.
Hh activation during regeneration exhausts HSC self-renewal. (a) Kinetics of peripheral blood cell recovery after hematopoietic ablation with a single dose of 5-FU. ■, mean WT values; ○, mean ptc-1+/− values (n = 4 mice per genotype). (b) Experimental design to compare WT and ptc-1+/− HSC repopulation capacity, progenitor output, and self-renewal capacity by secondary repopulation. (c) Percentage of CD45.2+ donor-derived WT or ptc-1+/− cells in recipient mice at 5 weeks after transplant. ○, single transplanted mice; ■, average level of repopulation (n = 5). (d) Percentage of CD45.2+ donor-derived WT or ptc-1+/− cells at 8 weeks after transplant. ○, single transplanted mice; ■, represent the average level of repopulation (n = 10). #, P < 0.001. (e) Multilineage flow cytometric analysis of WT and ptc-1+/− donor hematopoietic cells at 8 weeks after transplant (n = 8). (f) Average progenitor (CFU) output of WT and ptc-1+/− donor repopulating cells (n = 3). ∗, P < 0.05. (g) Percentage of CD45.2+ donor-derived WT or ptc-1+/− cells in secondary recipient mice at 6 weeks after transplant. ○, single transplanted mice; ■, the average level of repopulation (n = 6). ∗∗, P < 0.005. (h) Multilineage flow cytometric analysis of WT and ptc-1+/− donor hematopoietic cells in secondary recipient mice at 6 weeks after transplant (n = 3). (i) Average progenitor (CFU) output of WT and ptc-1+/− secondary repopulating cells (n = 3). ∗, P < 0.05.
Fig. 3.
Fig. 3.
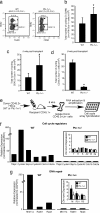
Hh activation modulates specific cell cycle regulators, leading to exhaustion of regenerating HSCs. (a) Representative flow cytometry gates for G0/G1, S, and G2/M phases of the cell cycle in primitive WT and ptc-1+/− hematopoietic cells. (b) Total number of cycling (S+G2/M) LSK WT and ptc-1+/− BM cells (n = 3). ∗, P < 0.05. (c) Total number of cycling Sca-1+ WT and ptc-1+/− donor repopulating cells at 5 weeks after transplant (n = 3). ∗, P < 0.05. (d) Total number of cycling Sca-1+ WT and ptc-1+/− donor repopulating cells at 8 weeks after transplant (n = 3). ∗, P < 0.05. (e) Experimental design to examine cell cycle-related gene expression in WT and ptc-1+/− Lin- repopulating cells by array hybridization. (f) (Inset) Relative expression of cell cycle regulator genes >3-fold differentially expressed between WT and ptc-1+/− Lin- repopulating cells, normalized to expression of GAPDH. Relative expression of these genes in de novo isolated WT and ptc-1+/− LSK BM cells is shown. (g) Relative expression of DNA repair genes >3-fold differentially expressed between WT and ptc-1+/− Lin- repopulating cells, normalized to expression of GAPDH. (Inset) Relative expression of these genes in de novo isolated WT and ptc-1+/− LSK BM cells is shown.
Fig. 4.
Fig. 4.
In vivo complementation of ptc-1+/− HSC functional and transcriptional defects by using cyclopamine. (a) Experimental design to examine the effects of in vivo administration of cyclopamine on repopulation, cell cycling, and self-renewal of ptc-1+/− HSCs. (Inset) Activation of Hh and Wnt signaling in ptc-1+/− and TOP-gal LSK cells after i.p. injection of cyclopamine as measured by the mean fluorescence intensity of β-gal after FDG staining (n = 3; ∗, P < 0.05). (b) Average frequency of donor-derived ptc-1+/− cells in recipient mice treated with cyclopamine or vehicle at 8 weeks after transplant (n = 3). Dashed line represents average repopulation of WT cells (Inset). Total CD45.1+ cells in recipient mice is shown. #, P < 0.001. (c) Average frequency of ptc-1+/− Lin- Sca-1+ repopulating cells in cycling state at 8 weeks after transplant, treated with cyclopamine or vehicle (n = 3). Dashed line represents average frequency of cycling WT cells. ∗, P < 0.05. (d) Average percentage of donor-derived ptc-1+/− cells in secondary recipient mice, treated in primary transplants with cyclopamine or vehicle (n = 6). Dashed lined represents average secondary repopulation of WT cells. ∗, P < 0.05. (e) Relative expression of cell cycle regulator genes in ptc-1+/− Lin- repopulating cells treated with cyclopamine or vehicle. Dashed line represents relative expression in WT cells. (f) Relative expression of DNA repair genes in ptc-1+/− Lin- repopulating cells treated with cyclopamine or vehicle.

References

    1. Hodgson GS, Bradley TR, Radley JM. Exp Hematol. 1982;10:26–35. - PubMed
    1. Cheng T, Rodrigues N, Shen H, Yang Y, Dombkowski D, Sykes M, Scadden DT. Science. 2000;287:1804–1808. - PubMed
    1. Roy S, Ingham PW. J Cell Sci. 2002;115:4393–4397. - PubMed
    1. Dyer MA, Farrington SM, Mohn D, Munday JR, Baron MH. Development (Cambridge, UK) 2001;128:1717–1730. - PubMed
    1. Gering M, Patient R. Dev Cell. 2005;8:389–400. - PubMed

Publication types

MeSH terms