. 2006:2:49.
doi: 10.1038/msb4100083. Epub 2006 Sep 12.

When transcriptome meets metabolome: fast cellular responses of yeast to sudden relief of glucose limitation

Affiliations

When transcriptome meets metabolome: fast cellular responses of yeast to sudden relief of glucose limitation

M T A P Kresnowati et al. Mol Syst Biol. 2006.

Abstract

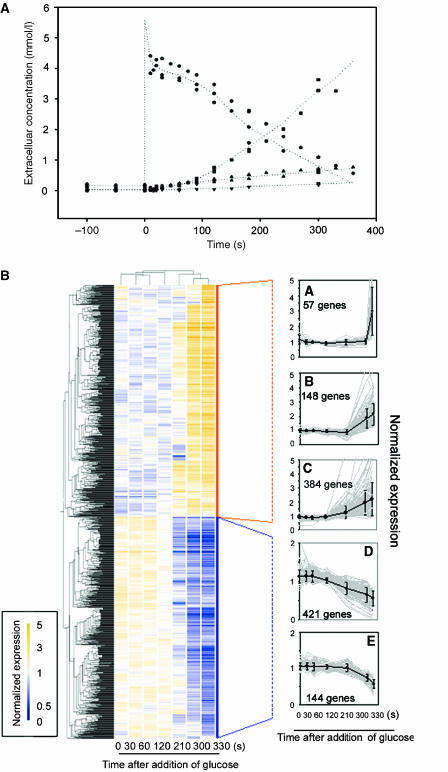
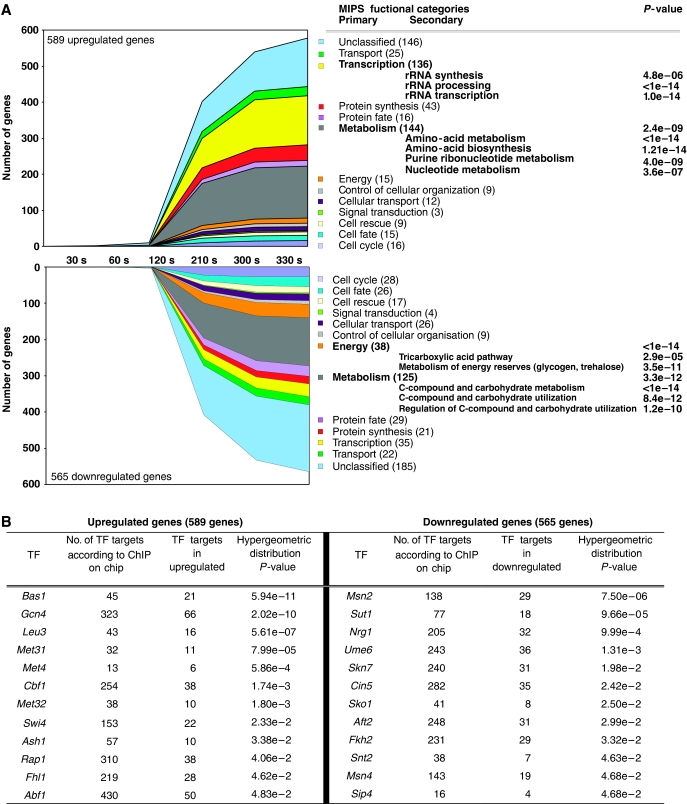
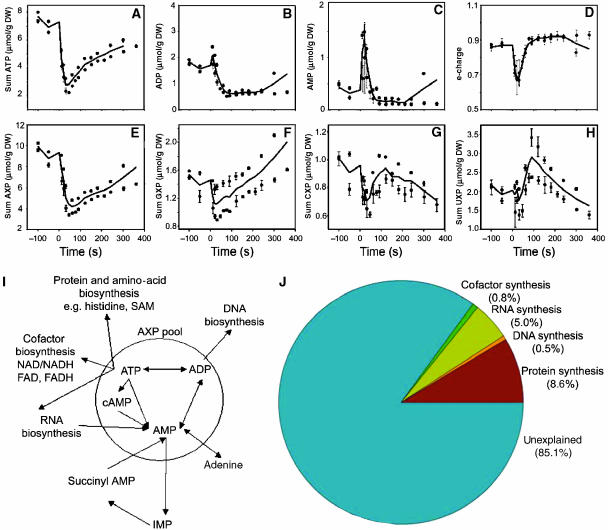
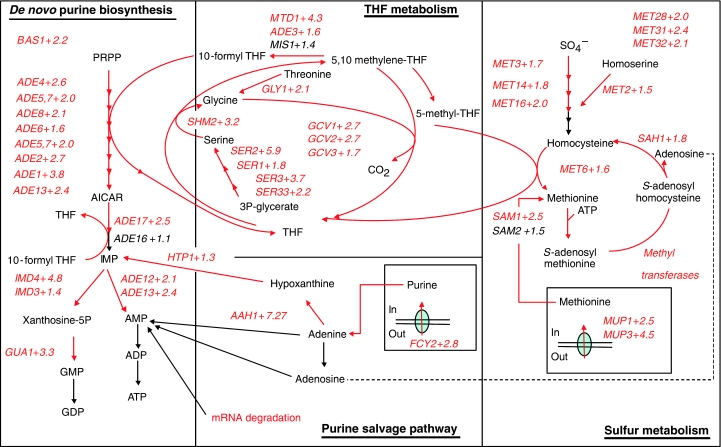
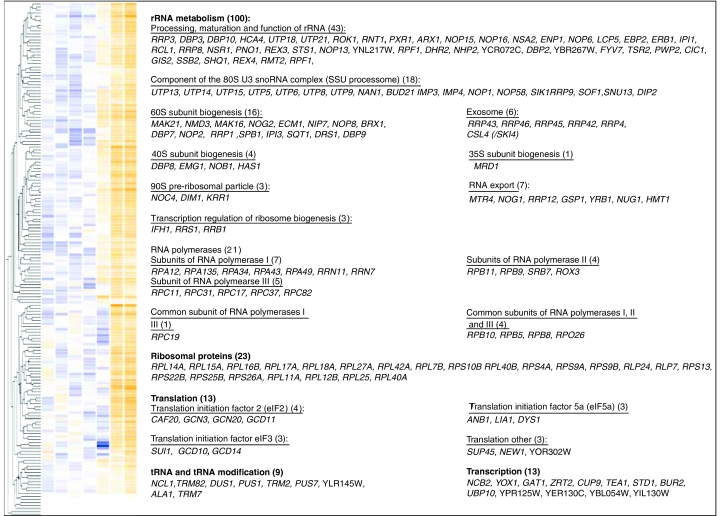
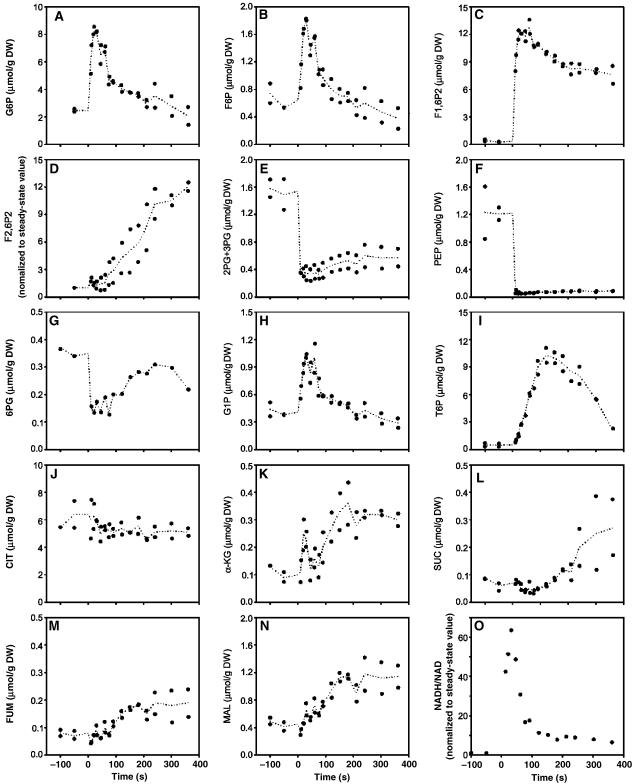
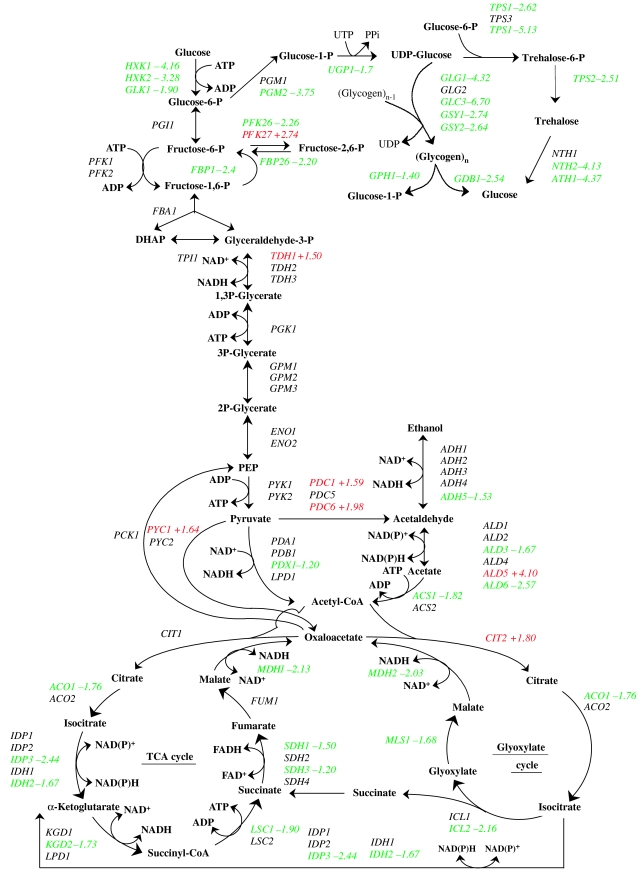
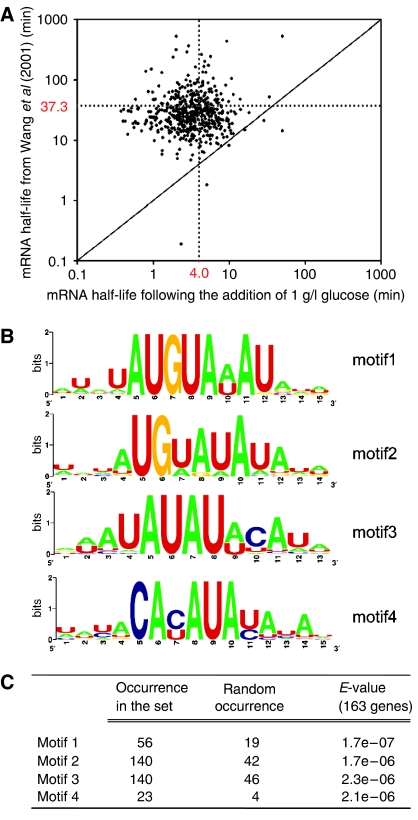
Within the first 5 min after a sudden relief from glucose limitation, Saccharomyces cerevisiae exhibited fast changes of intracellular metabolite levels and a major transcriptional reprogramming. Integration of transcriptome and metabolome data revealed tight relationships between the changes at these two levels. Transcriptome as well as metabolite changes reflected a major investment in two processes: adaptation from fully respiratory to respiro-fermentative metabolism and preparation for growth acceleration. At the metabolite level, a severe drop of the AXP pools directly after glucose addition was not accompanied by any of the other three NXP. To counterbalance this loss, purine biosynthesis and salvage pathways were transcriptionally upregulated in a concerted manner, reflecting a sudden increase of the purine demand. The short-term dynamics of the transcriptome revealed a remarkably fast decrease in the average half-life of downregulated genes. This acceleration of mRNA decay can be interpreted both as an additional nucleotide salvage pathway and an additional level of glucose-induced regulation of gene expression.


Figures

Figure 1
Figure 1
Response of glucose-limited chemostat (D=0.05/h) to a 5.6 mM glucose pulse. (A) Extracellular concentration of glucose (•), ethanol (▪), glycerol (▾) and acetate (▴) are plotted as a function of time (s). Two independent pulse experiments are represented. (B) Two-dimensional clustering heat-map of the differentially expressed genes in the glucose pulse experiment. Each expression datum represents the average of at least two independent replicates. Orange (relatively high expression) and blue (relatively low expression) squares were used to represent the transcription profiles of genes deemed specifically changed. K-means clusters of genes with ascendant profiles (A, B and C) and descendent profiles (D, E). The thick black line represents the average of the median normalized expression data of the genes comprising the cluster.
Figure 2
Figure 2
Interpretation of transcriptome data. (A) The 1154 differentially expressed genes were distributed over MIPS functional categories as a function of time (s). The number mentioned in brackets indicates the total number of genes found in the categories. Overrepresented primary and secondary functional categories according to a hypergeometric distribution analysis with a threshold P-value of 0.01 with Bonferroni correction are mentioned together with their calculated P-values. (B) Transcription factor analysis; the 1154 differentially expressed genes were intersected with transcription factor target genes according to the ChIP on chip analysis (Harbison et al, 2004) and the probability that the representation of each factor occurred by chance was assessed by hypergeometric distribution. The table displays significant factors that returned a P-value lower than 0.05.
Figure 3
Figure 3
Intracellular concentrations of mono-, di- and triphosphate nucleotides (AXP, CXP, GXP, UXP) in micromoles per gram of dry weight (μmol/g DW) following 5.6 mM glucose pulse. (A) ATP, (B) ADP, (C) AMP, (D) e-charge defined as the ratio (ATP+0.5 ADP)/(ATP+ADP+AMP), (E) ΣAXP, (F) ΣGXP, (G) ΣCXP, (H) ΣUXP and (I) possible adenine nucleotide utilization. ATP, ADP, AMP and cAMP comprise the adenine nucleotide (AXP) pool in which any reaction between them does not cause any depletion in the pool size. Outside the circle are the reactions that are consuming the adenine moiety of the AXP. Adapted from Chapman and Atkinson (1977). (J) Theoretical distribution of AXP based on change in the synthesis rate owing to growth acceleration (from μ=0.05/h to μmax=0.45/h). Detailed calculations are provided in Supplementary information 6. The data plotted originate from at least two independent pulse experiments.
Figure 4
Figure 4
Coordinated upregulation of the purine biosynthesis, sulfur assimilation and methionine and adenine salvage pathways. Metabolic pathways: The numbers indicated represent the fold change calculated between the expression values obtained at 330 s and the values obtained at the initial steady state (0 s).
Figure 5
Figure 5
Genes upregulated during the glucose pulse involved in transcription and translation functions according to MIPS categories. The independent replicate transcriptome datasetss for each time point were averaged and then compared. Blue (relatively low expression) and orange (relatively high expression) squares are used to represent the transcription profiles of genes deemed specifically changed.
Figure 6
Figure 6
Intracellular concentration of glycolytic and TCA cycle intermediates following 5.6 mM glucose pulse, expressed in micromoles per gram of dry weight (μmol/g DW) except mentioned otherwise. (A) Glucose-6-phosphate (G6P), (B) fructose-6-phosphate (F6P), (C) fructose-1,6-biphosphate (F1,6P2), (D) fructose-2,6-biphosphate (F2,6P2) expressed as normalized to the steady-state value (see Materials and methods), (E) 2 and 3 phosphoglycerate (2PG+3PG), (F) phosphoenolpyruvate (PEP), (G) 6-phosphogluconate (6PG), (H) glucose-1-phosphate (G1P), (I) trehalose-6-phosphate (T6P), (J) citrate (CIT), (K) α-keto-glutarate (αKG), (L) succinate (SUC), (M) fumarate (FUM), (N) malate (MAL) and (O) NADH/NAD ratio expressed as normalized to the steady-state value. The data plotted originate from at least two independent pulse experiments.
Figure 7
Figure 7
Addition of glucose to a steady-state culture triggers an acceleration of the mRNA turnover. Effect of glucose pulse on expression of genes of the glycolytic, storage carbohydrate and TCA cycle metabolic pathways. The numbers represent the fold change calculated between the expression values obtained at 330 s and at the initial steady state (0 s). Green labels represent a downregulation and red labels represent an upregulation.
Figure 8
Figure 8
(A) Scatter plot comparing mRNA half-life measured by Wang et al (2002) and the mRNA half-life calculated from the data of this study. The dashed line represents the average value of half-life. (B) Motifs identified in the 3′ untranslated regions of the 163 genes downregulated belonging to overrepresented functional categories ‘energy' and ‘metabolism'. (C) Significance of the representation of motif identified in the tested set.

References

    1. Albig AR, Decker CJ (2001) The target of rapamycin signaling pathway regulates mRNA turnover in the yeast Saccharomyces cerevisiae. Mol Biol Cell 12: 3428–3438 - PMC - PubMed
    1. Bachellerie JP, Cavaille J (1997) Guiding ribose methylation of rRNA. Trends Biochem Sci 22: 257–261 - PubMed
    1. Barrett T, Suzek TO, Troup DB, Wilhite SE, Ngau WC, Ledoux P, Rudnev D, Lash AE, Fujibuchi W, Edgar R (2005) NCBI GEO: mining millions of expression profiles—database and tools. Nucleic Acids Res 33: D562–D566 - PMC - PubMed
    1. Belde PJ, Vossen JH, Borst-Pauwels GW, Theuvenet AP (1993) Inositol 1,4,5-trisphosphate releases Ca2+ from vacuolar membrane vesicles of Saccharomyces cerevisiae. FEBS Lett 323: 113–118 - PubMed
    1. Blaiseau PL, Thomas D (1998) Multiple transcriptional activation complexes tether the yeast activator Met4 to DNA. EMBO J 17: 6327–6336 - PMC - PubMed

Publication types

MeSH terms