. 1990 Aug 17;249(4970):755-9.
doi: 10.1126/science.1697101.

An antibody binding site on cytochrome c defined by hydrogen exchange and two-dimensional NMR

Affiliations

An antibody binding site on cytochrome c defined by hydrogen exchange and two-dimensional NMR

Y Paterson et al. Science. .

Abstract

The interaction of a protein antigen, horse cytochrome c (cyt c), with a monoclonal antibody has been studied by hydrogen-deuterium (H-D) exchange labeling and two-dimensional nuclear magnetic resonance (2D NMR) methods. The H-exchange rate of residues in three discontiguous regions of the cyt c polypeptide backbone was slowed by factors up to 340-fold in the antibody-antigen complex compared with free cyt c. The protected residues, 36 to 38, 59, 60, 64 to 67, 100, and 101, and their hydrogen-bond acceptors, are brought together in the three-dimensional structure to form a contiguous, largely exposed protein surface with an area of about 750 square angstroms. The interaction site determined in this way is consistent with prior epitope mapping studies and includes several residues that were not previously identified. The hydrogen exchange labeling approach can be used to map binding sites on small proteins in antibody-antigen complexes and may be applicable to protein-protein and protein-ligand interactions in general.


Figures
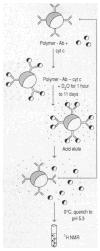
Fig. 1
Fig. 1
Procedure for hydrogen exchange on antibody-bound cyt c. Affinity-purified MAb E8 (17) (100 mg) was coupled to 12 ml (packed gel volume) of Affigel 10 (Bio-Rad) according to the manufacturers instructions. The polymer-bound antibody was incubated with 25 mg of oxidized horse cyt c (Sigma, Type VI) in 50 mM KH2/K2HPO4 buffer (pH 7.0) for 2 hours at room temperature with gentle rocking and was then transferred to a column (1.5 cm by 30 cm). Unbound cyt c was removed by washing copiously with potassium phosphate buffer to leave ~11 mg of antigen bound to E8. To initiate exchange, the column was washed into D2O (50 mM KH2/K2HPO4 at pD 7.0) and incubated at 20°C for time intervals ranging from 1 hour to 11 days in a series of H-D exchange experiments. Subsequent manipulations, designed to re-isolate cyt c while minimizing further H-D exchange, were performed at 8°C. The column was washed with D2O with low buffer capacity (1 mM KH2/K2HPO4 at pD 6.0), and cyt c was then eluted in a minimal volume of 0.2 M acetic acid, 1M NaCl at pD 2.5. Fractions (1-ml volume) were collected into 0.3 ml of cold 0.5 M KH2/K2HPO4 buffer at pD 7.5 containing 40 mM ascorbic acid to reduce cyt c and produce a final pD of ~5.3. The fractions were pooled and concentrated on an Amicon filter (YM5) to 400 μl for NMR analysis (1.5 to 2 mM cyt c). These procedures were carried out at seven different hydrogen-exchange incubation times (1, 3, 8, 9, 26, 92, and 266 hours).
Fig. 2
Fig. 2
Sections of 2D NMR spectra of representative cyt c samples after partial H-D exchange in the presence (left) and absence (right) of the E8 MAb. Exchange experiments were carried out with samples in the oxidized form following the procedures described in Fig. 1 for the antibody-bound samples. The NMR spectra were then recorded at 20°C on ~1.5 mM samples of reduced cyt c in D2O at pD 5.3. Expanded contour plots containing most of the NH-CαH cross peaks are shown for 2D J-correlated spectra (COSY) recorded in the magnitude mode (26) at 500 MHz on a Bruker AM 500 spectrometer. Cross peaks are labeled with the assignments reported by Wand et al. (16, 27). Four additional cross peaks from slowly exchanging amide protons (residues 7, 68, 70, and 99) lie outside the spectral region shown. A spectral width of 9090 Hz was used in both dimensions; 128 transients of 1024 complex data points were recorded for each of 400 t1 increments. The data were processed on a Micro VAX II computer with the program FTNMR (courtesy of Hare Research, Woodinville, Washington). Unshifted sine multiplication and 3-Hz line-broadening were applied in each dimension prior to Fourier transformation. The final digital resolution was 8.9 Hz in both dimensions. Cross-peak volumes were determined by volume integration with a three-point radius for resolved peaks and a two-point radius in crowded areas. The average volume of three cross peaks from nonlabile protons was used as an internal intensity standard to normalize the data between spectra.
Fig. 3
Fig. 3
Effect of antibody binding on the kinetics of H-D exchange for some amide protons in horse cyt c. The normalized intensity for resolved NH-CαH cross peaks in COSY spectra (see Fig. 2) is plotted as a function of the H-exchange time in the bound form (□, solid lines) and in the free form (○, dashed lines). The data for free oxidized cyt c were obtained from earlier H-exchange studies (18, 28). The curves are exponential fits determined by nonlinear least-squares analysis.
Fig. 4
Fig. 4
Computer graphics representations of the E8 epitope on horse cyt c (29). (A) The α-carbon backbone of horse cyt c is shown in violet, the main chain of the residues identified in Table 1 of this study and their hydrogen-bond acceptors are shown in yellow, and the amide hydrogen-donor and carbonyl group hydrogen-bond acceptor are shown in blue and red, respectively. (B) A surface view of the epitope with the residues protected from hydrogen exchange identified in this study (excluding Gln12) and their hydrogen-bond acceptors shown in orange (that is, 35 to 38, 59 to 67, 96, 97, 100, and 101). Also shown in orange is residue 99 identified previously (25). Residues that are thought not to be part of the epitope from this study (3 to 5, 7 to 11, 13 to 15, 17 to 19, 29, 31 to 33, 68 to 71, 74, 75, 85, 87 to 89, and 91 to 93) and from a previous study (25) (8, 22, 25, 27, 39, 53, 55, 72, 73, 79, 86, and the ε atoms of 99) are colored magenta. Residues not yet identified are shown in gray.

Similar articles

Cited by

References

    1. Amit AG, Mariuzza RA, Phillips SEV, Poljak RJ. Science. 1986;233:747. - PubMed
    2. Sheriff S, et al. Proc Natl Acad Sci USA. 1987;84:8075. - PMC - PubMed
    3. Colman PM. Adv Immunol. 1988;43:99. - PubMed
    1. Davies DR, Sheriff S, Padlan EA. J Biol Chem. 1988;263:10,541. - PubMed
    1. Benjamin DC, et al. Annu Rev Immunol. 1984;2:67. - PubMed
    2. Jemmerson R, Paterson Y. Bio Techniques. 1986;4:1818.
    1. Cooper HM, et al. J Biol Chem. 1987;262:11,591.
    1. Collawn JF, Wallace CJA, Proudfoot AEI, Paterson Y. 1988;263:8625. ibid. - PubMed

Publication types

LinkOut - more resources