

The network of sheep movements within Great Britain: Network properties and their implications for infectious disease spread
- PMID: 16971335
- PMCID: PMC1664651
- DOI: 10.1098/rsif.2006.0129
The network of sheep movements within Great Britain: Network properties and their implications for infectious disease spread
Abstract
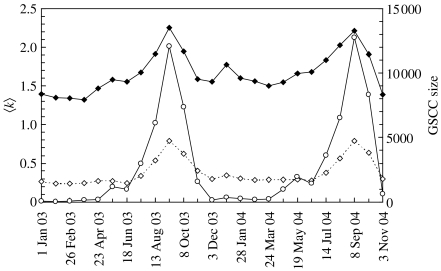
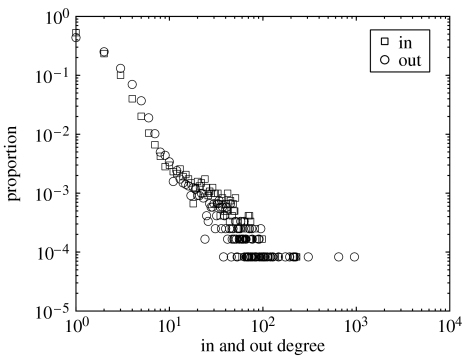
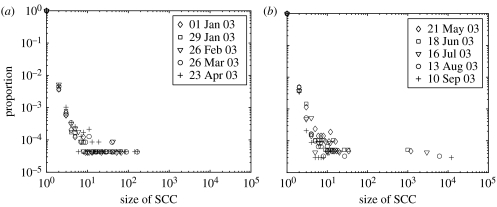
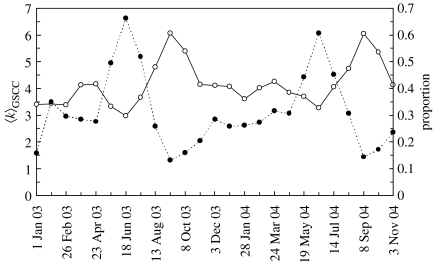
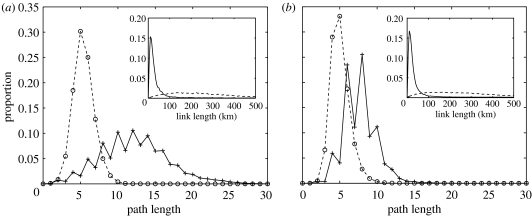
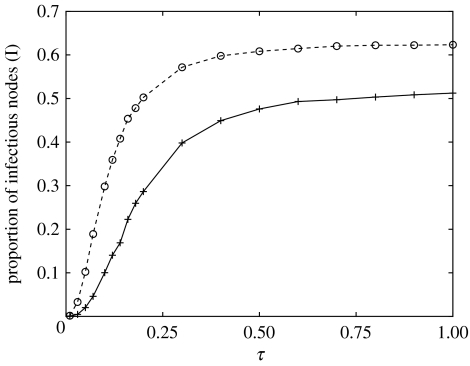
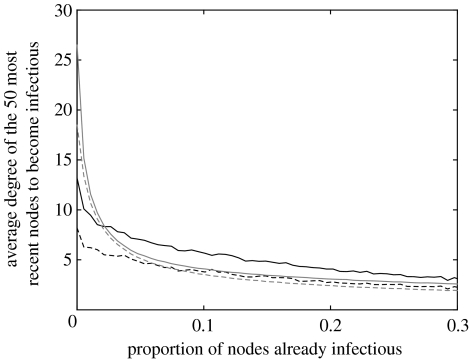
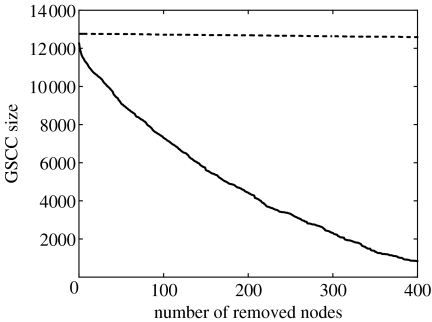
During the 2001 foot and mouth disease epidemic in the UK, initial dissemination of the disease to widespread geographical regions was attributed to livestock movement, especially of sheep. In response, recording schemes to provide accurate data describing the movement of large livestock in Great Britain (GB) were introduced. Using these data, we reconstruct directed contact networks within the sheep industry and identify key epidemiological properties of these networks. There is clear seasonality in sheep movements, with a peak of intense activity in August and September and an associated high risk of a large epidemic. The high correlation between the in and out degree of nodes favours disease transmission. However, the contact networks were largely dissasortative: highly connected nodes mostly connect to nodes with few contacts, effectively slowing the spread of disease. This is a result of bipartite-like network properties, with most links occurring between highly active markets and less active farms. When comparing sheep movement networks (SMNs) to randomly generated networks with the same number of nodes and node degrees, despite structural differences (such as disassortativity and higher frequency of even path lengths in the SMNs), the characteristic path lengths within the SMNs are close to values computed from the corresponding random networks, showing that SMNs have 'small-world'-like properties. Using the network properties, we show that targeted biosecurity or surveillance at highly connected nodes would be highly effective in preventing a large and widespread epidemic.
Figures
References
-
- Albert R, Barabási A.L. Statistical mechanics of complex networks. Rev. Mod. Phys. 2002;74:47–97. doi:10.1103/RevModPhys.74.47 - DOI
-
- Albert R, Jeong H, Barabási A.L. Error and attack tolerance of complex networks. Nature. 2000;406:378–382. doi:10.1038/35019019 - DOI - PubMed
-
- Anderson R.M, May R.M. Oxford University Press; Oxford, UK: 1991. Infectious diseases of humans: dynamics and control.
-
- Barbour A.D. MacDonald's model and the transmission of Bilharzia. Trans. R. Soc. Trop. Med. Hyg. 1978;72:6–15. doi:10.1016/0035-9203(78)90290-0 - DOI - PubMed
-
- Barthélemy M, Barrat A, Pastoras-Satorras R, Vespignani A. Velocity and hierarchical spread of epidemic outbreaks in scale-free networks. Phys. Rev. Lett. 2004;92:178 701. doi:10.1103/PhysRevLett.92.178701 - DOI - PubMed
Publication types
MeSH terms
Grants and funding
LinkOut - more resources
Full Text Sources