. 2006 Sep 13;26(37):9482-93.
doi: 10.1523/JNEUROSCI.1672-06.2006.

Expression of multiple P2X receptors by glossopharyngeal neurons projecting to rat carotid body O2-chemoreceptors: role in nitric oxide-mediated efferent inhibition

Affiliations

Expression of multiple P2X receptors by glossopharyngeal neurons projecting to rat carotid body O2-chemoreceptors: role in nitric oxide-mediated efferent inhibition

Verónica A Campanucci et al. J Neurosci. .

Abstract

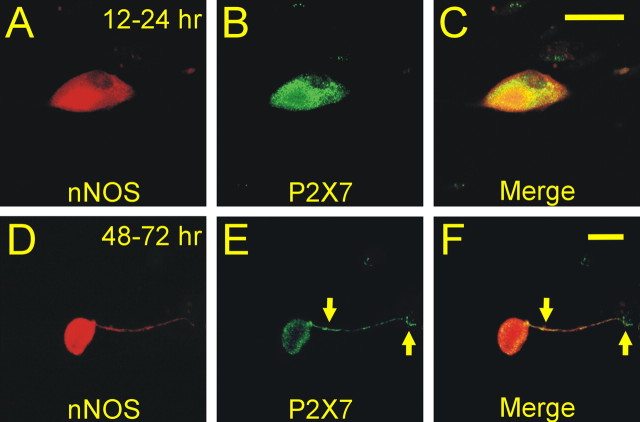
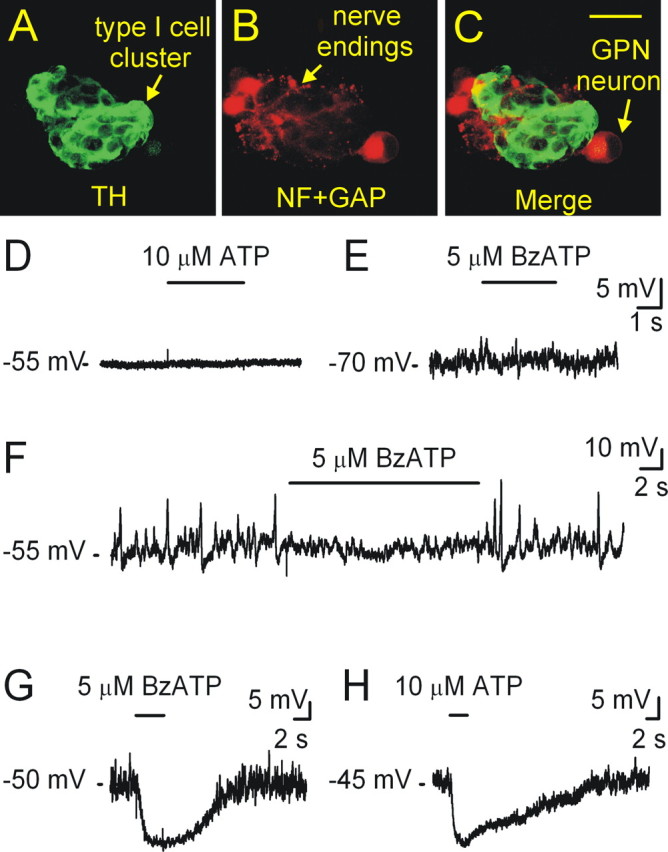
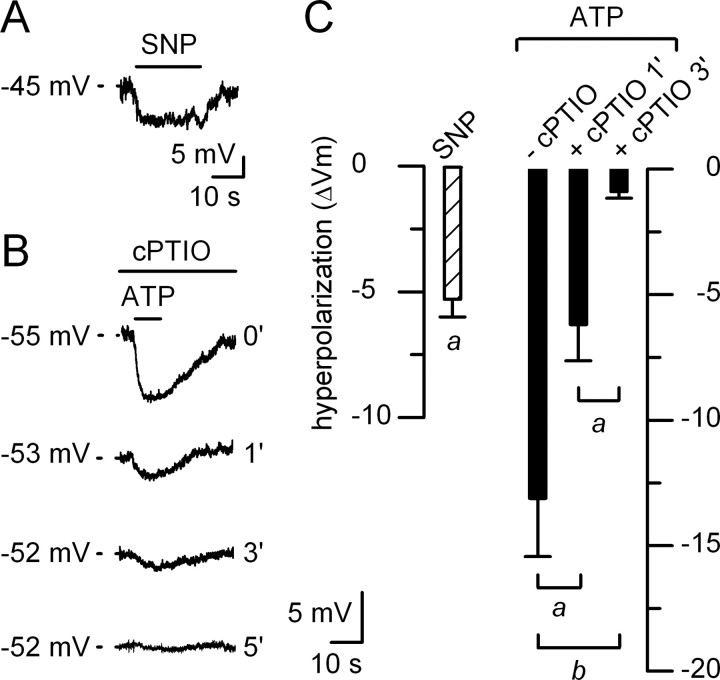
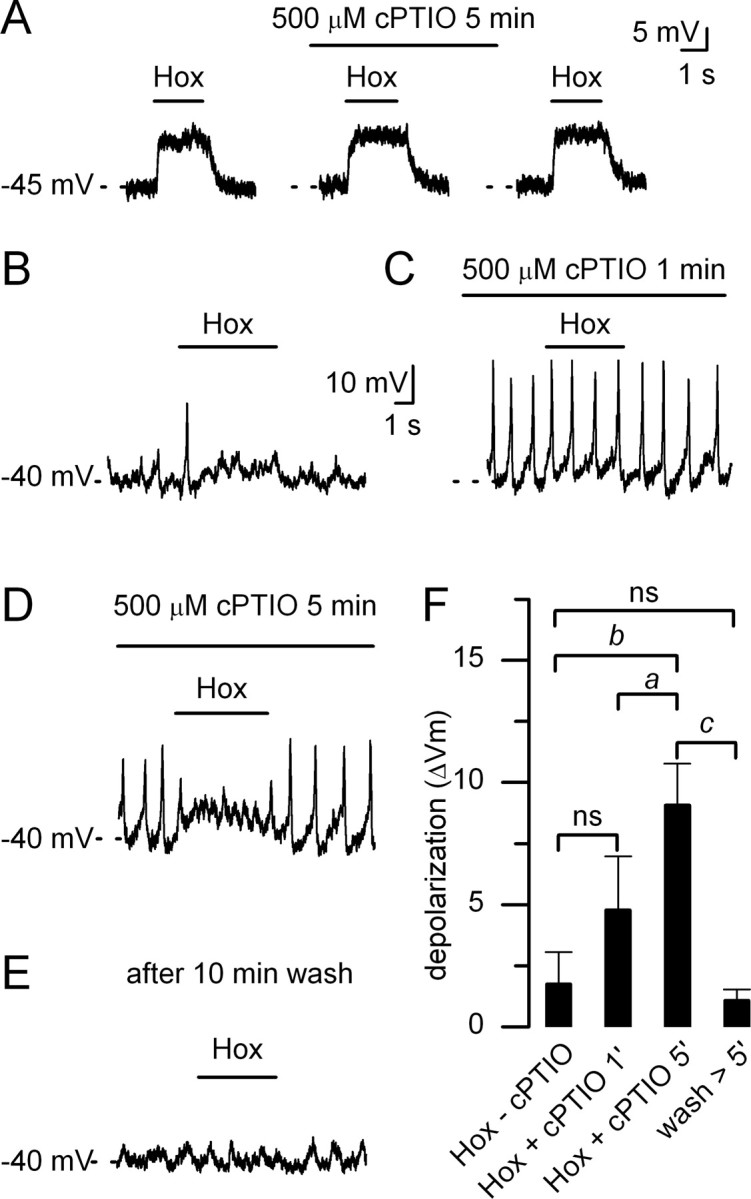
In mammals, ventilation is peripherally controlled by the carotid body (CB), which receives afferent innervation from the petrosal ganglion and efferent innervation from neurons located along the glossopharyngeal nerve (GPN). GPN neurons give rise to the "efferent inhibitory" pathway via a plexus of neuronal nitric oxide (NO) synthase-positive fibers, believed to be responsible for CB chemoreceptor inhibition via NO release. Although NO is elevated during natural CB stimulation by hypoxia, the underlying mechanisms are unclear. We hypothesized that ATP, released by rat CB chemoreceptors (type 1 cells) and/or red blood cells during hypoxia, may directly activate GPN neurons and contribute to NO-mediated inhibition. Using combined electrophysiological, molecular, and confocal immunofluorescence techniques, we detected the expression of multiple P2X receptors in GPN neurons. These receptors involve at least four different purinergic subunits: P2X2 [and the splice variant P2X2(b)], P2X3, P2X4, and P2X7. Using a novel coculture preparation of CB type I cell clusters and GPN neurons, we tested the role of P2X signaling on CB function. In cocultures, fast application of ATP, or its synthetic analog 2',3'-O-(4 benzoylbenzoyl)-ATP, caused type I cell hyperpolarization that was prevented in the presence of the NO scavenger 2-(4-carboxyphenyl)-4,4,5,5-tetramethyl-imidazoline-1-oxyl-3-oxide potassium. These data suggest that ATP released during hypoxic stress from CB chemoreceptors (and/or red blood cells) will cause GPN neuron depolarization mediated by multiple P2X receptors. Activation of this pathway will lead to calcium influx and efferent inhibition of CB chemoreceptors via NO synthesis and consequent release.


Figures

Figure 1.
Figure 1.
ATP-evoked responses in O2-sensitive GPN neurons. A, B, Representative traces showing the effects of hypoxia (Hox) and ATP, respectively, on membrane potential of the same distal GPN neuron 24 h after isolation. Traces obtained during current-clamp recording. C, Voltage-clamp current recordings of ATP-evoked inward currents at −60 mV attributable to increasing concentrations of ATP applied to a distal GPN neuron. D, Dose–response curve for ATP is shown on the right for a group of 11 GPN neurons (apparent EC50 of 10.5 μm). E, Traces of ATP-evoked current in a GPN neuron at different membrane potentials. F, I–V plot of ATP-evoked current for a group of seven neurons; note inward rectification and reversal potential at ∼0 mV.
Figure 2.
Figure 2.
Effects of ATP agonists and antagonists on GPN neurons. A, Current traces show a representative example of α,β-MeATP-evoked currents at −60 mV attributable to increasing concentrations of the agonist on a distal GPN neuron. B, Dose–response curve for α,β-MeATP is shown for a group of five distal neurons (EC50 of 3.2 μm). C, Current traces evoked by application of 50 μm ATP in the presence of increasing doses (values on left, in micromolar) of the nonselective purinergic receptor antagonist suramin. D, Dose–response curve of the inhibitory effect of suramin on the ATP-evoked response in a group of five distal GPN neurons. Note that even high doses of suramin were insufficient to block completely the currents evoked by 50 μm ATP.
Figure 3.
Figure 3.
Effects of P2X7 agonists and antagonists on GPN neurons. A, Representative current traces elicited by application of ATP (10 μm) and the high-potency P2X7 agonist BzATP (10 μm) at −60 mV on a distal GPN neuron. B, Dose–response curve for BzATP is shown for a group of four distal GPN neurons (EC50 of 1.9 μm). C, Example current traces showing the effects of the P2X7 receptor blocker BBG on BzATP-evoked currents; concentrations of BBG are shown to the right of traces. D, Dose–response curve for BBG inhibition of BzATP-evoked currents (n = 5). Note that BBG at nanomolar concentrations blocked a component of the BzATP-evoked current, suggesting the functional expression of P2X7 homomeric receptors in GPN neurons.
Figure 4.
Figure 4.
Effect of pretreatment with OxATP on the suramin sensitivity of the ATP-evoked response in GPN neurons. A, Example traces showing the effects of 0 and 500 μm suramin (sur) on the ATP-evoked (50 μm) currents from cells under two different conditions, control (left traces) and after preincubation with the irreversible P2X7-selective blocker OxATP at 500 μm (2 h at 37°C; right traces). Note that, after preincubation with OxATP, suramin (500 μm) abolished the ATP-evoked response in this cell. B, Histogram comparing the ATP-evoked current density (in picoamperes per picofarad) with and without 500 μm suramin. Data are presented as mean ± SEM; black bars represent control (without OxATP; n = 5), and white bars represent cells pretreated with OxATP (n = 11). ap < 0.05; cp < 0.001. C, Dose–response curve for ATP is shown for cells preincubated with OxATP. Data obtained from OxATP pretreated cells (solid line) are compared with those from control untreated cells (dotted line); note the significant reduction in EC50 for the OxATP-treated group (EC50 of ∼2.5 μm) relative to control (EC50 of ∼10.5 μm; p < 0.05; n = 5).
Figure 5.
Figure 5.
Effects of IVM on the ATP-evoked current in GPN neurons. A, IVM (10 μm) caused potentiation of the currents evoked by 2 μm ATP; this occurred in 5 of 13 cells tested. These data provide functional evidence for the expression of P2X4 purinergic receptors in GPN neurons. In addition, IVM caused inhibition of the ATP-evoked response in 5 of 13 cells (as exemplified in B) and had no effect in the remaining cases (C).
Figure 6.
Figure 6.
Detection of mRNA for P2X2, P2X3, P2X4, and P2X7 in excised tissue samples containing distal GPN neurons. RT-PCR was performed on these samples using gene-specific primers for P2X2/P2X2(b) (designated P2X2a,b), P2X3, P2X4, and P2X7 subunits and the housekeeping gene GAPDH (G). Expected product sizes are as follows: P2X2/P2X2(b), 600 and 400 bp; P2X3, 326 bp; P2X4, 408 bp; P2X7, 400; and GAPDH, 230 bp. The ladder lane (L) shows bands at 100 bp increments. In negative control reactions without RT (−), no PCR products were observed. PCR products were identified with 2% agarose gel stained with ethidium bromide and viewed under UV illumination.
Figure 7.
Figure 7.
Localization of purinergic subunits in GPN neurons in situ by confocal immunofluorescence. Proximal neurons located at the bifurcation of the GPN and CSN expressed both P2X2 (A; red) and P2X3 (B; green) immunofluorescence; note colocalization in merged images. C, Similarly, many neurons at the distal bifurcation coexpressed P2X2 and P2X3 subunits (D–F). G–I show colocalization of P2X4 purinergic subunit (green) with the neuronal marker NF (red) in proximal GPN neurons. In J–L, there is colocalization of P2X4 (red) and P2X3 (green) subunits in the distal population of GPN neurons. Scale bars: A–F, 50 μm; G–L, 100 μm.
Figure 8.
Figure 8.
Immunolocalization of P2X subunits in GPN neurons and in nerve processes adjacent to CB chemoreceptors in situ. A–C, Colocalization of P2X7 purinergic subunit (red) with the neuronal marker NF (green) in proximal GPN neurons. In contrast, in D–F, the distal GPN neurons failed to express P2X7 subunits in their NF-positive soma (K) but were surrounded by P2X7-positive nerve endings (D–F). G–I, Colocalization of P2X7 (green) and neuronal markers (NF+GAP; red) on nerve endings in tissue sections of rat CB. Nerve processes surround CB type I cell clusters that are not labeled in this section; arrows in H and I show regions of colocalization. Note that the P2X7 labeling at bottom right in H and I was not associated with nerve endings (arrowhead). J, Localization of TH and P2X7 immunoreactivity in CB tissue section; note that punctuate P2X7 immunostaining (green) is closely associated with a TH-positive (red) type I cell cluster. K, Localization of nNOS and P2X7 immunoreactivity in CB tissue section. Note the close association of punctate nNOS-immunoreactive processes (green) with TH-positive (red) type I cells. In control experiments, preincubation with blocking peptides for P2X7 and P2X4 antibodies abolished all immunostaining in L and M, respectively. Scale bars: A–C, G–I, 50 μm; D–F, 100 μm; J, K, 10 μm.
Figure 9.
Figure 9.
Confocal immunolocalization of nNOS and P2X7 subunits in cultured GPN neurons from the distal population. A–C, Colocalization of nNOS and P2X7 immunoreactivity in same neuronal cell body ∼24 h after isolation (i.e., approximate culture duration for patch-clamp experiments). D–F, Similar experiment as in A–C, except that immunostaining was done 48–72 h after cell isolation. Note that, at this time, P2X7 immunoreactivity was less concentrated in cell bodies and was detected along neuronal processes and their endings. Scale bars, 30 μm.
Figure 10.
Figure 10.
Effects of ATP and BzATP on the membrane potential of type I cells cultured with and without JGPN neurons. A–C, Confocal immunofluorescence of coculture showing a cluster of TH-positive type I cells (green) in intimate association with several JGPN neurons and their processes that were immunopositive for NF and GAP-43 (red). Scale bar, 50 μmm. D, E, Lack of effect of ATP (10 μm) and BzATP (5 μm) applied by rapid perfusion during the period indicated by the top horizontal bars on the membrane potential of type I cells cultured alone. In F–H, recordings were obtained from type I cells in close proximity to JGPN neurons (A–C), which therefore could be directly stimulated during application of the P2X agonist. In F, application of BzATP caused inhibition of spontaneous activity in a type I cell, whereas in G and H, there was a marked type I cell hyperpolarization during application of BzATP and ATP, respectively.
Figure 11.
Figure 11.
Effect of the NO donor sodium nitroprusside on the resting potential of type I cells and the NO scavenger cPTIO on the ATP-induced hyperpolarization in type I cells cocultured with GPN neurons. In A, exposure of type I cell cultures (grown in the absence of GPN neurons) to SNP (500 μm) caused a reversible hyperpolarization of a type I cell membrane potential. In B, a 5 min incubation of the coculture with the NO scavenger cPTIO (500 μm) caused a gradual reduction of the ATP-induced hyperpolarization in a type I cell, presumably mediated indirectly via NO release from activated adjacent JGPN neurons. C, Hatched bar on left shows the mean amplitude of type I cell hyperpolarization (ΔVm) caused by SNP (n = 9) in CB cultures grown without neurons; initial resting potential was −47.3 ± 4.8 mV. Filled bars on right compare time-dependent changes in magnitude of the ATP-induced hyperpolarization (ΔVm) in a group of cocultured type I cells (n = 6) when exposed to cPTIO for 0, 1, and 3 min as in B. Data are presented as mean ± SEM. ap < 0.05; bp < 0.001.
Figure 12.
Figure 12.
Effects of hypoxia on membrane potential of type I cells cocultured with JGPN neurons. A, Representative example showing the lack of effect of cPTIO on the hypoxia (Hox)-induced depolarization (i.e., receptor potential) in type I cells cultured in the absence of GPN neurons. B, Perfusion with a hypoxic solution (PO2 of ∼5 mmHg) caused a mild depolarization and spike generation in a type I cell that was part of a cell cluster grown in the presence of nearby JGPN neurons. C, After 1 min incubation of the coculture with the NO scavenger cPTIO (500 μm), there was an increase in basal spontaneous spike activity of the type I cell. D, After 5 min incubation with cPTIO, there was a potentiation of the original response to hypoxia (see A). E, All of these effects were fully reversible after washout of the drug for 10 min. F, Histogram compares the time-dependent effect of cPTIO on the hypoxia-induced depolarization in a group (n = 5) of similar cocultured type I cells. Data are presented as mean ± SEM. ap < 0.05; bp < 0.01; cp < 0.001.
Figure 13.
Figure 13.
Fitted curves for the dose–response relationship for ATP at P2X receptors expressed in GPN neurons compared with heterologously expressed P2X2–P2X3 heteromultimeric receptors (Lewis et al., 1995) and P2X4 (Bo et al., 1995) and P2X7 (Chessell et al., 1998) homomultimeric receptors. The solid curve for native receptors in GPN neurons reflects a combination of the properties of the other receptors.

Similar articles

Cited by

References

    1. Bianchi BR, Lynch KJ, Touma E, Niforatos W, Burgard EC, Alexander KM, Park HS, Yu H, Metzger R, Kowaluk E, Jarvis MF, van Biesen T. Pharmacological characterization of recombinant human and rat P2X receptor subtypes. Eur J Pharmacol. 1999;376:127–138. - PubMed
    1. Bo X, Zhang Y, Nassar M, Burnstock G, Schoepfer R. A P2X purinoceptor cDNA conferring a novel pharmacological profile. FEBS Lett. 1995;375:129–133. - PubMed
    1. Brake AJ, Wagenbach MJ, Julius D. New structural motif for ligand-gated ion channels defined by an ionotropic ATP receptor. Nature. 1994;371:519–523. - PubMed
    1. Burnstock G. Purinergic signaling and vascular cell proliferation and death. Arterioscler Thromb Vasc Biol. 2002;22:364–373. - PubMed
    1. Buttigieg J, Nurse CA. Detection of hypoxia-evoked ATP release from chemoreceptor cells of the rat carotid body. Biochem Biophys Res Commun. 2004;322:82–87. - PubMed

Publication types

MeSH terms

LinkOut - more resources