. 2006 Sep 13;26(37):9548-59.
doi: 10.1523/JNEUROSCI.1727-06.2006.

Odorant deprivation reversibly modulates transsynaptic changes in the NR2B-mediated CREB pathway in mouse piriform cortex

Affiliations

Odorant deprivation reversibly modulates transsynaptic changes in the NR2B-mediated CREB pathway in mouse piriform cortex

Hyun H Kim et al. J Neurosci. .

Abstract

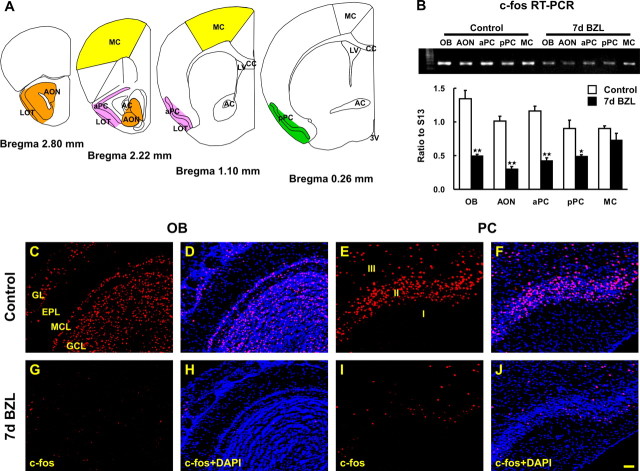
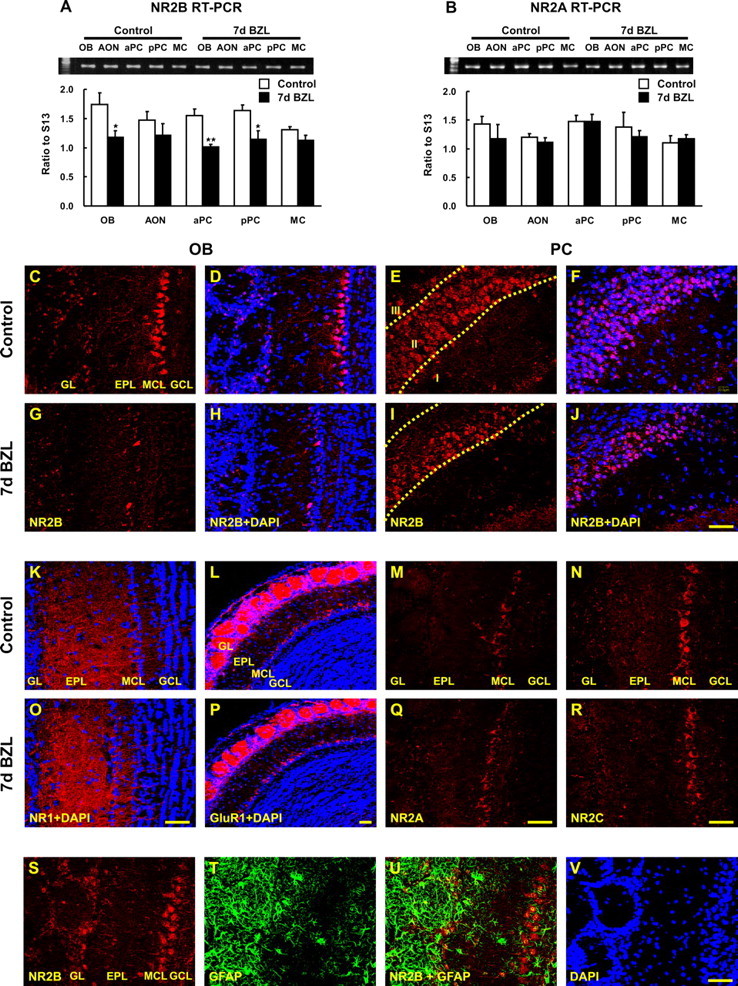
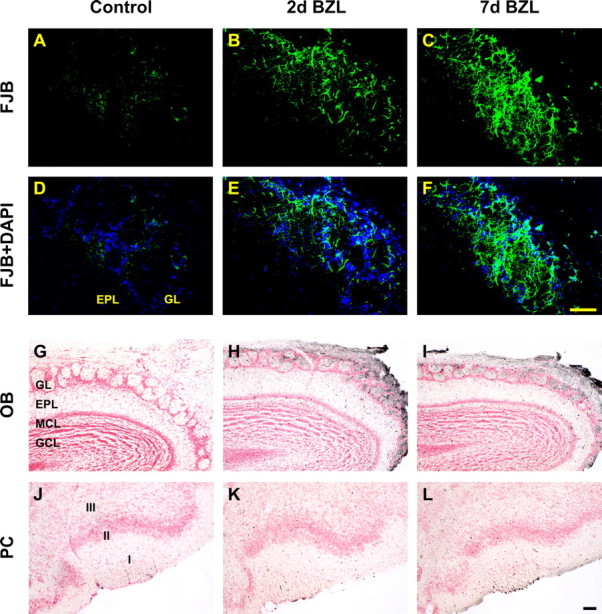
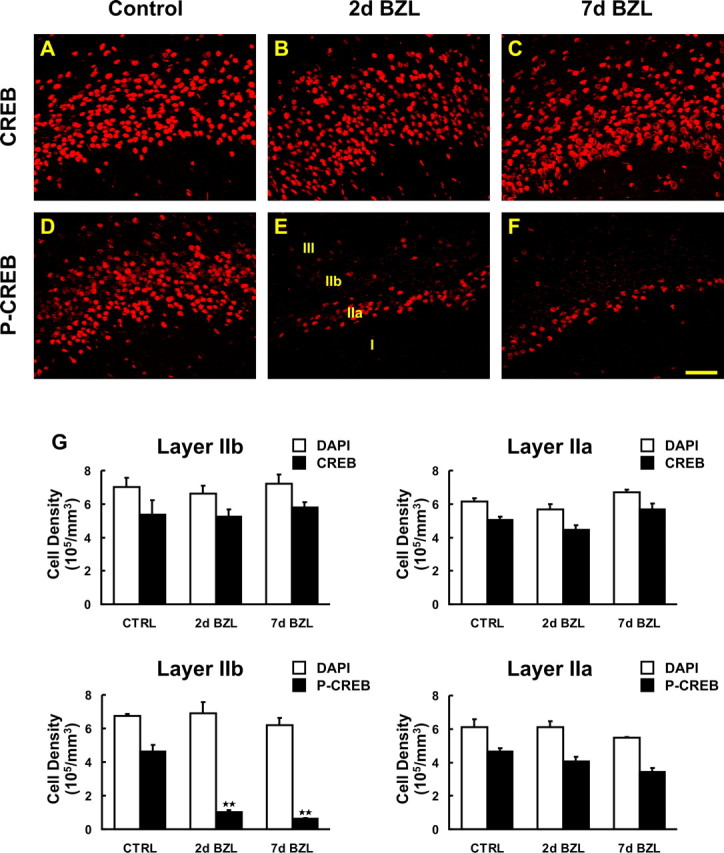
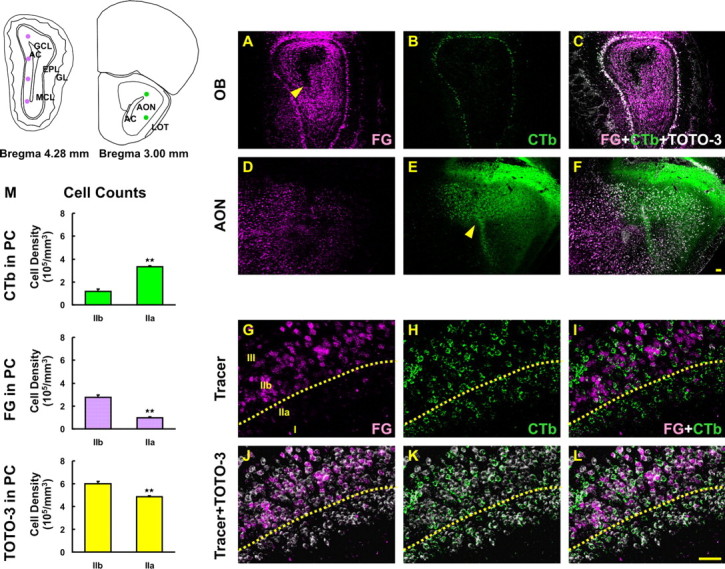
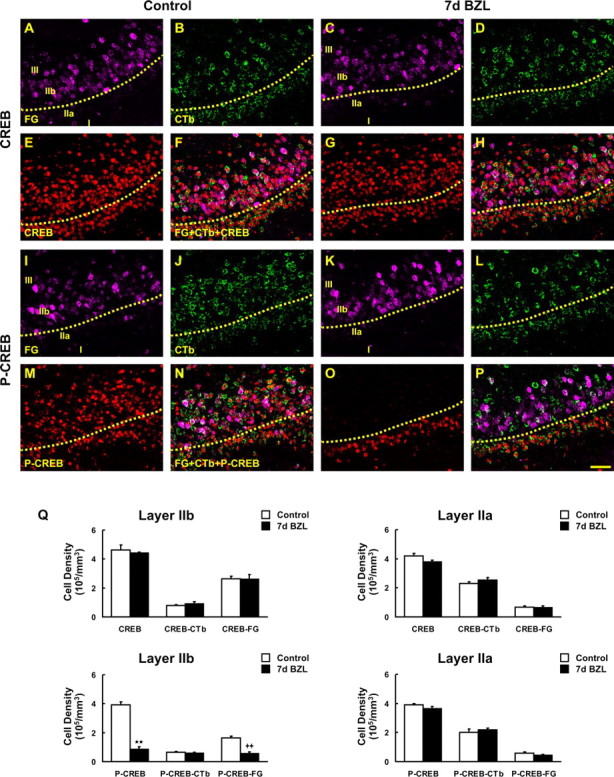
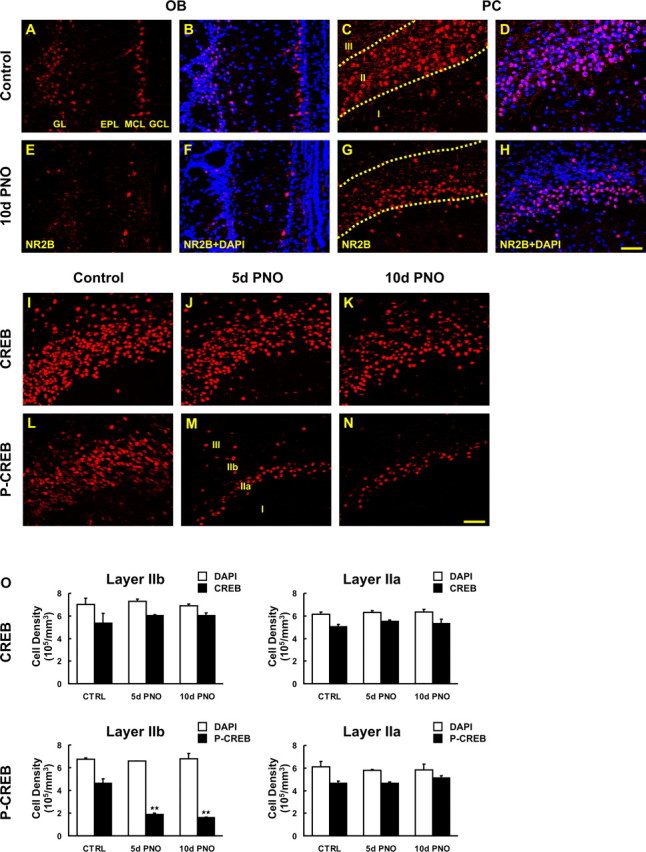
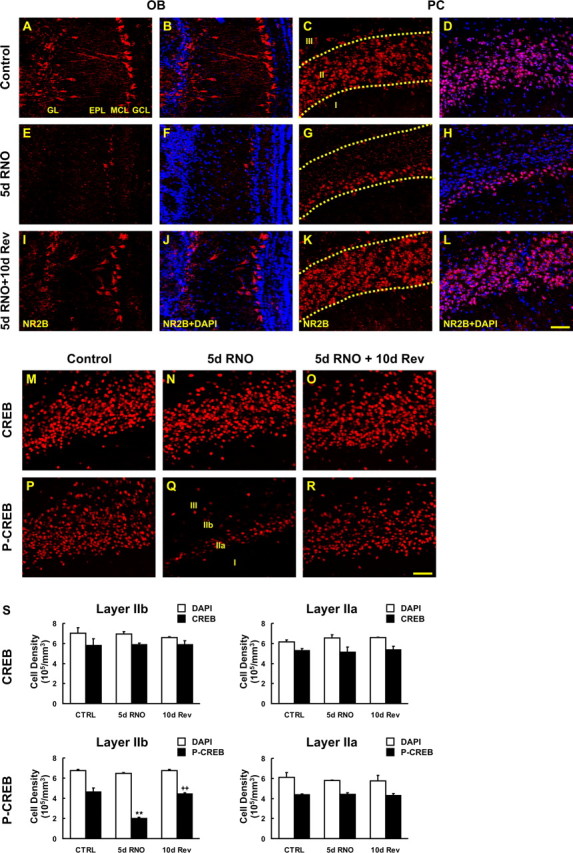
The olfactory system is an outstanding model for understanding activity-dependent neuronal plasticity in mammals. Olfactory sensory neurons (OSNs) in the periphery project onto mitral/tufted cells in the olfactory bulb (OB) and these mitral/tufted cells in turn project to piriform cortex (PC). Numerous studies have examined changes in OB after a permanent OSN ablation, but little is known about "trans-transsynaptic" changes taking place in the PC. Permanent zinc sulfate lesion of the olfactory epithelium resulted in a selective loss of the NMDA receptor NR2B protein and mRNA expression in pyramidal cells in layer IIb of PC after 2-7 d. Regulatory elements affected by NR2B signaling, namely the phosphorylation of CREB, were also downregulated only in layer IIb neurons. These changes could be caused by OSN axon loss in the zinc sulfate lesion, or to a reduced activity. To test this hypothesis, we performed both permanent and reversible naris occlusion, which blocks odorant access to the nasal cavities and OSN activity. The expression of NR2B and phospho-CREB were downregulated 5 d after occlusion and this reduction was fully restored 10 d after reopening of the naris. Subsequently, we identified the subset of pyramidal cells in layer IIb that are especially sensitive to the loss of odor-evoked activity using double retrograde tracers. In summary, the present study provides an initial characterization of the molecular mechanisms associated with odor stimulation on second order neuronal plasticity and phenotype in the olfactory system.


Figures

Figure 1.
Figure 1.
Reduction of c-Fos protein and mRNA expression in OB and PC after bilateral zinc sulfate lesion. A, The diagram depicts the areas where we microdissected AON (orange), aPC (pink), pPC (green), and MC (yellow). B, The amount of c-fos mRNA was measured by semiquantitative RT-PCR and was reduced 7 d after bilateral zinc sulfate lesion (BZL) in OB, AON, aPC, and pPC but not in MC [two-way ANOVA across all tissues and lesions; F(4, 30) = 6.80; p < 0.01; post hoc Tukey’s comparisons revealed significant differences between control and BZL groups in these olfactory tissues (*p < 0.05; **p < 0.01)]. Data are means + SEM (n = 4). c-Fos immunostaining was visualized by confocal microscopy (red) and nuclei were counterstained with DAPI (blue). C–J, Seven days after BZL, c-Fos immunoreactivity was markedly reduced in OB (G, H) and PC (I, J) compared with the control OB (C, D) and PC (E, F). Scale bar, 50 μm. 3V, Third ventricle; AC, anterior commissure; CC, corpus callosum; EPL, external plexiform layer; GCL, granule cell layer; GL, glomerular layer; LOT, lateral olfactory tract; LV, lateral ventricle; MCL, mitral cell layer.
Figure 2.
Figure 2.
Expression of glutamate receptors in OB and PC after bilateral zinc sulfate lesion. The amount of NR2B and NR2A mRNA expression was measured by semiquantitative RT-PCR. A, B, NR2B expression declined 7 d after bilateral zinc sulfate lesion (BZL) (A) in OB, aPC, and pPC [two way ANOVA across all tissues and lesions, F(4, 30) = 0.91, p = 0.47, no interaction between lesion and tissue; one-way ANOVA for the main effect of the lesion, F(1, 30) = 25.18, p < 0.01; post hoc Tukey’s comparisons revealed the significant differences between control and BZL groups in OB, aPC, and pPC (*p < 0.05; **p < 0.01)], whereas NR2A was not significantly affected by BZL (B). Data are means + SEM (n = 4). IHC for NR2B, NR1, GluR1, NR2A, and NR2C was visualized by confocal microscopy (red) and nuclei were counterstained with DAPI (blue). C–J, Seven days after BZL, NR2B immunoreactivity was markedly reduced in OB (G, H) and only in deep layer II (IIb) of PC (I, J) compared with the control OB (C, D) and PC (E, F). K–R, In contrast, NR1, GluR1, NR2A, and NR2C immunostaining 7 d after BZL (O–R) were similar to their controls (K–N) in OB and PC (data not shown). S, T, V, OB coronal sections from control were stained for NR2B (S), GFAP (T), and DAPI (V). U, GFAP-positive glial cells were not colabeled with NR2B either in control (U) or lesion (data not shown). NR2B and GFAP double labeling demonstrated that astrocytes are not expressing NR2B. Scale bars, 50 μm. EPL, External plexiform layer; GCL, granule cell layer; GL, glomerular layer; MCL, mitral cell layer.
Figure 3.
Figure 3.
Detection of degenerating neurons in OB and PC after bilateral zinc sulfate lesion. Neuronal degeneration was visualized by FJB staining (A–F, green) and amino cupric silver staining (G–L, black). FJB staining was increased 2 and 7 d after deafferentation in OB (B, C) compared with control (A), but not in PC (data not shown). Two and seven days after, degenerating neurons stained with silver were apparent in OB (H, I, respectively) but not in PC (K, L) compared with the control OB (G) and PC (J). Scale bars, 50 μm. EPL, External plexiform layer; GCL, granule cell layer; GL, glomerular layer; MCL, mitral cell layer.
Figure 4.
Figure 4.
Expression of CREB and phospho-CREB (p-CREB) protein after bilateral zinc sulfate lesion. A–F, CREB and phospho-CREB expression was visualized by immunostaining (red) in PC of control mice (A, D), and 2 d (B, E) and 7 d (C, F) after bilateral zinc sulfate lesion (BZL). G, The density of total nuclei and CREB/phospho-CREB-positive cells per unit volume was stereologically quantified in layers IIa (right) and IIb (left) for CREB (top) and phospho-CREB (bottom). Two and seven days after BZL, phospho-CREB immunoreactivity was markedly reduced in layer IIb (E, F) whereas CREB immunoreactivity was not changed (B, C) compared with the controls (D, A) (**p < 0.01). Data are means + SEM (n = 3). Scale bar, 50 μm.
Figure 5.
Figure 5.
Retrograde labeling in PC after injection of tracers into OB and AON. The simplified diagram depicts the injection sites of FG in OB and CTb in AON. A, D, G, FG (violet) was injected in OB (A, arrowhead) and retrogradely transported into AON (D) and PC (G). B, E, H, CTb (green) was injected in AON (E, arrowhead) and retrogradely transported back to OB (B) and into PC (H). C, F, J–L, Sections were counterstained with TOTO-3 iodide (white). I, FG-labeled cells were found predominantly in layer IIb whereas CTb-labeled cells were in layer IIa. M, Labeled cells were stereologically counted and the data represent a significant difference between two subsets of pyramidal cells in layers of IIa and IIb (two-tailed Student’s t test, **p < 0.01). Data are means + SEM (n = 3). Scale bars, 50μm.
Figure 6.
Figure 6.
Phosphorylation of CREB in FG- and CTb-labeled pyramidal cells after deafferentation. A–E, G, I–M, O, FG- (violet; A, C, I, K) and CTb-labeled (green; B, D, J, L) pyramidal cells were colabeled with CREB (E, G) and phospho-CREB (p-CREB; M, O) antibody (red). F, H, Pyramidal cells traced by FG and CTb were both stained with CREB either in control (F) or at 7 d after bilateral zinc sulfate lesion (BZL) (H). N, P, Sections were also double labeled with phospho-CREB in control (N) and 7 d after BZL (P). The subset of pyramidal cells labeled with FG lost phospho-CREB labeling after BZL and most of these cells are located in layer IIb whereas CTb-labeled cells in layer IIa still express phospho-CREB even after zinc sulfate lesion (P). Q, Stereological cell counts revealed a significant decrease in phospho-CREB- and FG-double-labeled cell density after zinc sulfate lesion (**p < 0.01; ++p < 0.01). Data are means + SEM (n = 3). Scale bar, 50 μm.
Figure 7.
Figure 7.
Activity-dependent changes in expression of NR2B and phosphorylation of CREB after permanent naris occlusion. Sections of mouse brain taken after 5 and 10 d of permanent naris occlusion (PNO) were processed for NR2B, CREB, and phospho-CREB (p-CREB) IHC. A–H, Reduction in NR2B immunoreactivity was observed in the deprived bulb (E, F) and its ipsilateral PC (G, H) compared with the undeprived bulb (A, B) and its PC (C, D). Note that a major reduction was seen only in IIb. I–N, CREB and phospho-CREB-positive pyramidal cells were visualized (red) in PC from control (I, L), 5 d (J, M) and 10 d (K, N) after PNO. O, The density of total nuclei and CREB/phospho-CREB-positive cells in unit volume was stereologically quantified in layers IIa (right) and IIb (left) for CREB (top) and phospho-CREB (bottom). Phospho-CREB immunoreactivity was markedly reduced 5 and 10 d after PNO (M, N), and the reduction was restricted to layer IIb. However, CREB immunostaining was unchanged after PNO (J, K) compared with the control (I) (**p < 0.01). Data are means + SEM (n = 3). Scale bar, 50 μm.
Figure 8.
Figure 8.
Recovery of deprivation-induced reduction of NR2B-expression and CREB phosphorylation. Sections from mice taken after 5 d of reversible naris occlusion (RNO) and 10 d of recovery (Rev) were processed for NR2B, CREB, and phospho-CREB (p-CREB) IHC. A–H, Reduction in NR2B immunoreactivity was observed in the deprived bulb (E, F) and its ipsilateral PC (G, H) compared with the undeprived bulb (A, B) and its PC (C, D). I–L, NR2B expression was also recovered to the same as control at 10 d after reinstatement in OB (I, J) and PC (K, L). N, Q, R, After 5 d RNO, phospho-CREB immunostaining (Q) but not CREB (N) was reduced in layer IIb and this reduction was reversed at 10 d after removal of plugs (R). S, The density of total nuclei and CREB/phospho-CREB-positive cells per unit volume was stereologically quantified in layers IIa (right) and IIb (left) for CREB (top) and phospho-CREB (bottom). Five days after RNO, phospho-CREB-immunoreactive cell number was significantly reduced in layer IIb compared with the control, and the recovery on retrieval of activity was significant (**p < 0.01). Data are means + SEM (n = 3). Scale bar, 50 μm.

Similar articles

Cited by

References

    1. Bading H, Greenberg ME. Stimulation of protein tyrosine phosphorylation by NMDA receptor activation. Science. 1991;253:912–914. - PubMed
    1. Baker H, Kawano T, Margolis FL, Joh TH. Transneuronal regulation of tyrosine hydroxylase expression in olfactory bulb of mouse and rat. J Neurosci. 1983;3:69–78. - PMC - PubMed
    1. Baker H, Towle AC, Margolis FL. Differential afferent regulation of dopaminergic and GABAergic neurons in the mouse main olfactory bulb. Brain Res. 1988;450:69–80. - PubMed
    1. Baker H, Morel K, Stone DM, Maruniak JA. Adult naris closure profoundly reduces tyrosine hydroxylase expression in mouse olfactory bulb. Brain Res. 1993;614:109–116. - PubMed
    1. Balschun D, Wolfer DP, Gass P, Mantamadiotis T, Welzl H, Schutz G, Frey JU, Lipp HP. Does cAMP response element-binding protein have a pivotal role in hippocampal synaptic plasticity and hippocampus-dependent memory? J Neurosci. 2003;23:6304–6314. - PMC - PubMed

Publication types

MeSH terms

LinkOut - more resources