. 2006 Sep 13;26(37):9567-78.
doi: 10.1523/JNEUROSCI.2256-06.2006.

Macaque V2 neurons, but not V1 neurons, show choice-related activity

Affiliations

Macaque V2 neurons, but not V1 neurons, show choice-related activity

Hendrikje Nienborg et al. J Neurosci. .

Abstract

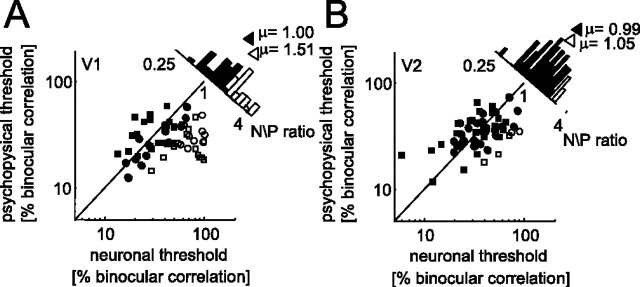
In the macaque extrastriate cortex, robust correlations between perceptual choice and neuronal response have been demonstrated, frequently quantified as choice probabilities (CPs). Such correlations are modest in early visual cortex, suggesting that CPs may depend on the position of a neuron in the hierarchy of visual processing. However, previous studies have not compared neurons with similar precision in equivalent tasks. We investigated the role of cortical hierarchy on CP using a task for which significant CPs have been described previously for middle temporal area (MT). We measured CPs in disparity-selective neurons from both V1 and V2. The stimulus was a dynamic random dot stereogram, presented with a near or a far disparity, masked by varying numbers of binocularly uncorrelated dots. Two macaque monkeys reported whether they perceived a circular patch in front or behind a surrounding annulus in a forced choice task. For V2 (n = 69), CP was on average 0.56, the first demonstration of systematic CPs in a visual area as early as V2. In V1 (n = 74), average CP was at chance level (0.51). The pattern was similar in a subgroup of neurons selected such that the statistical precision in the task was on average identical to that reported for MT (mean CP, 0.51 for V1, n = 33; 0.58 for V2, n = 54). This difference between V1 and V2 could not be explained by eye movements, stimulus size relative to the receptive field, or differences in disparity tuning. Rather, it seems to reflect a functional difference (at least in disparity processing) between striate and extrastriate cortex.


Figures

Figure 1.
Figure 1.
Calculating the neuronal and psychophysical threshold. In A, the statistical reliability (expressed as percentage correct) of an example V1 neuron (see Materials and Methods and Results) for discriminating between the preferred and the null disparity is plotted as a function of percentage binocular correlation (% correlation, logarithmic scale; open circles). Superimposed is the psychometric curve from the same experiment (filled squares). Both curves are fitted with cumulative Gaussian functions (solid line for neurometric; dotted line for psychometric curve). The neuronal (16%) and psychophysical (17%) thresholds are defined as the SD of the cumulative Gaussian (see Materials and Methods). B shows the mean responses (in spikes per second; error bars depict SEs) of the same V1 neuron as a function of the level of binocular correlation (% correlation). Responses to stimuli containing the preferred and null disparity are represented by the solid line (squares) and dashed line (circles), respectively.
Figure 2.
Figure 2.
Comparing neuronal and psychophysical thresholds. Data from V1 (n = 59) and V2 (n = 58) are drawn in A and B, respectively. The circles correspond to data from monkey duf, and the squares correspond to data from monkey ruf. Neuronal thresholds on the abscissa are plotted against the psychophysical threshold on the ordinate (both in percentage binocular correlation). The diagonal (solid line) is the identity line. Frequency histograms of the ratio (neuronal threshold)/(psychophysical threshold) are represented in the top right of each scatterplot. The mean N/P ratio (μ) for V1 is 1.51, and is 1.05 for V2 (open triangles). The filled symbols and filled bars in the histogram correspond to the subpopulation of neurons whose mean N/P ratio (μ) equals that for MT neurons (1.00 for V1 and 0.99 for V2; filled triangles).
Figure 3.
Figure 3.
Trial-to-trial covariation between neuronal firing and perceptual choice in two example neurons. The left column shows data obtained from V1, and the right column shows data from V2. Disparity tuning curves are plotted in A and B. The filled circles correspond to the disparity values chosen for the correlation threshold task. The filled square depicts the response to an uncorrelated RDS. The disparity selectivity is similar for both neurons (DDI, 0.71 for the V1 neuron; DDI, 0.70 for the V2 neuron). In C and D, frequency histograms of the responses are shown for different levels of binocular correlation (in percentage). Trials on which the monkey chose the preferred disparity are shown by filled bars, and null disparity choices are represented by open bars. Note that, for the V1 neuron, the response distributions are similar for both types of choices, resulting in CPs ∼0.5, whereas for the V2 neuron, the trials on which the monkey chose the preferred disparity target tended to yield higher responses. This is reflected in the CPs that are >0.5 for all correlation values.
Figure 4.
Figure 4.
Mean CP as a function of signed binocular correlation (negative and positive values represent stimuli at the null and preferred disparity, respectively). The average CP across all neurons (n = 74 for V1, circles; n = 69 for V2, squares) is plotted. Error bars depict SE.
Figure 5.
Figure 5.
Distribution of grand choice probabilities. Data from 74 V1 neurons are shown in A, and data from 69 V2 neurons are shown in B. The filled bars correspond to cells whose CP was significantly different from 0.5. The mean CP for V1 is 0.51, and for V2 is 0.56 (both indicated by the triangles).
Figure 6.
Figure 6.
Grand choice probabilities for the V1 and V2 subpopulations with mean N/P ratios close to 1 (as reported for MT neurons) (Uka and DeAngelis, 2003a). All symbols are identical with those in Figure 5. Mean CPs for these subpopulations are 0.51 for V1 (n = 33) and 0.58 for V2 (n = 54).
Figure 7.
Figure 7.
Vergence eye movements do not affect CP. A plots V1 data (n = 72), and B plots V2 data (n = 68). The circles and squares represent data from monkeys ruf and duf, and the filled and open symbols denote cells with significant (p < 0.05) and nonsignificant grand choice probabilities, respectively. Grand choice probability on the abscissa is compared with the CP calculated only for the responses to the uncorrelated stimulus (which does not depend on vergence eye movement) on the ordinate. Choice probabilities calculated in both ways are highly correlated, and the values are not systematically different (paired t test).
Figure 8.
Figure 8.
No significant effect of vertical eye position on CP. A plots data for monkey duf. The filled and open symbols depict data from V1 (n = 34) and V2 (n = 34), respectively. Grand choice probabilities calculated from response in the first second of each trial (abscissa) are compared against CPs obtained from the response during the second one-half of each trial. Both for V1 and for V2, there is no systematic difference between the CPs during the first and the second half of each trial (paired t test). Mean CPs are 0.51 vs 0.52 for V1, and 0.58 vs 0.59 for V2. B represents data for monkey ruf. The filled symbols show V2 data (n = 20), and the open symbols show V1 data (n = 9). In these experiments, small differences in the vertical position of the fixation point were applied. This allowed us to factor out the animal's small vertical eye movements, comparing responses only across trials with similar vertical eye positions. The grand choice probability calculated after the correction for vertical eye position (abscissa) is compared against the uncorrected grand choice probability (ordinate). Both values are significantly correlated (V2 values, rs = 0.51, p < 0.05; V1 values, rs = 0.7, p < 0.05), and the values are not systematically different for V2 or V1 (paired t test).
Figure 9.
Figure 9.
CP does not depend on the relative size between the stimulus and the receptive field in 68 V2 neurons. The symbol convention is identical with that of Figure 7. Grand choice probability is plotted against the ratio of the stimulus size (in degrees) over the receptive field size (quantified as the mean of the horizontal and vertical equivalent width in degrees).
Figure 10.
Figure 10.
Relationship between interneuronal noise correlation (weighted by signal correlation) and CP. Each noise correlation [correlation between single unit (SU) and multiunit (MU)] is weighted by the MU–SU signal correlation (both expressed as Fisher's Z-scores), so that large values mean that the noise correlation was high and the tuning curves were similar. A and B depict V1 and V2 data, respectively. The symbols are as in Figure 7. Both metrics are correlated for V2 (n = 69; rs = 0.28; p < 0.05) and not for V1 (n = 74; rs = 0.15; p = 0.2).
Figure 11.
Figure 11.
Similarity of preferred disparity for single-unit (SU) and multiunit (MU) activity. V1 data are shown in A, and V2 data are shown in B. The circles depict data from monkey duf, and the squares depict data from monkey ruf. Both axes plot the peak disparity (in degrees) of the disparity tuning curve, for the SU activity on the abscissa and for the MU activity on the ordinate. The correlation between the peak disparity for SU and MU activity is weak in V1 (rs = 0.18; p = 0.16; n = 62) and much stronger in V2 (rs = 0.84; p < 0.001; n = 90).
Figure 12.
Figure 12.
Time course of the response. For 69 V2 neurons, the average of the normalized response within each 10 ms bin is shown separately for trials on which the monkey chose the preferred (thin solid line) and null (dashed line) disparity target (left y-axis). Superimposed is the averaged difference of the responses (thick solid line; right y-axis).

Comment in

  • In-depth investigation: how low can you go?
    Clark AM, Wallisch P. Clark AM, et al. J Neurosci. 2007 Feb 7;27(6):1235-6. doi: 10.1523/jneurosci.4907-06.2007. J Neurosci. 2007. PMID: 17290508 Free PMC article. No abstract available.

References

    1. Allouni AK, Thomas OM, Solomon SG, Krug K, Parker AJ. Local and global binocular matching in V2 of the awake macaque. Soc Neurosci Abstr. 2005;35:510–518.
    1. Bair W, O'Keefe LP. The influence of fixational eye movements on the response of neurons in area MT of the macaque. Vis Neurosci. 1998;15:779–786. - PubMed
    1. Bair W, Zohary E, Newsome WT. Correlated firing in macaque visual area MT: time scales and relationship to behavior. J Neurosci. 2001;21:1676–1697. - PMC - PubMed
    1. Bracewell RN. Ed 2. Singapore: McGraw-Hill; 1986. The Fourier transform and its applications.
    1. Bradley DC, Chang GC, Andersen RA. Encoding of three-dimensional structure-from-motion by primate area MT neurons. Nature. 1998;392:714–717. - PubMed

Publication types

MeSH terms