. 2006 Sep;27(8):1770-5.

Relationship between variations in the circle of Willis and flow rates in internal carotid and basilar arteries determined by means of magnetic resonance imaging with semiautomated lumen segmentation: reference data from 125 healthy volunteers

Affiliations

Relationship between variations in the circle of Willis and flow rates in internal carotid and basilar arteries determined by means of magnetic resonance imaging with semiautomated lumen segmentation: reference data from 125 healthy volunteers

H Tanaka et al. AJNR Am J Neuroradiol. 2006 Sep.

Abstract

Background and purpose: Volume flow rates in the feeding arteries of the brain are measured to evaluate blood flow dynamics in vascular disease. Although these flow values are thought to be effected by anatomic variations in the circle of Willis, few reports have described the effect. This study reports on the relationship between variations in the circle of Willis and volume flow rates in the bilateral internal carotid and basilar arteries of normal volunteers.

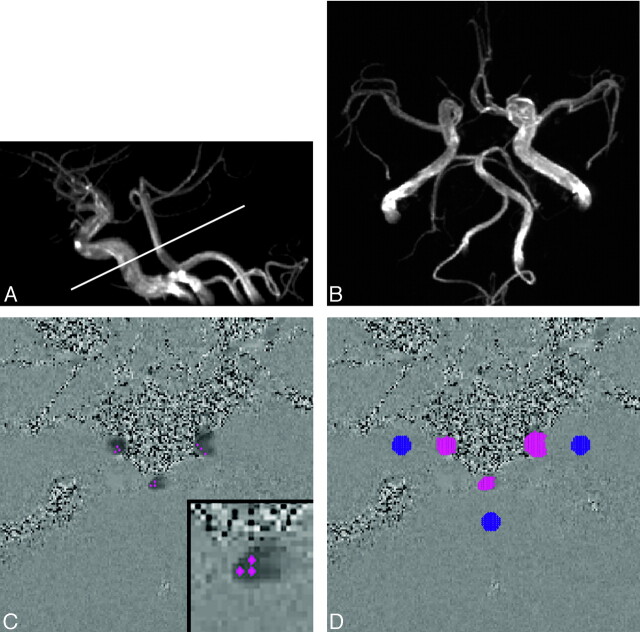
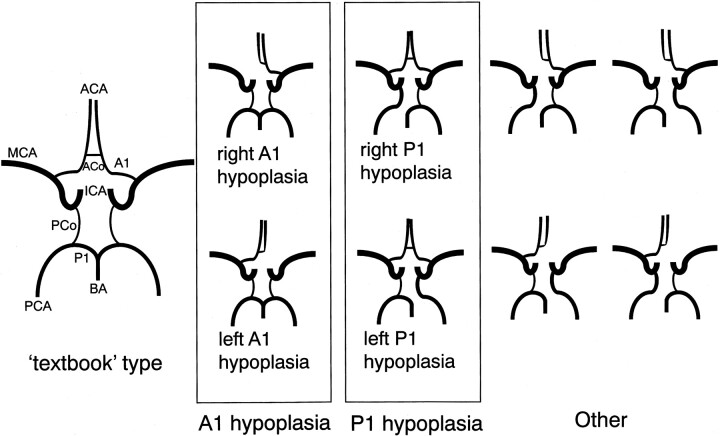
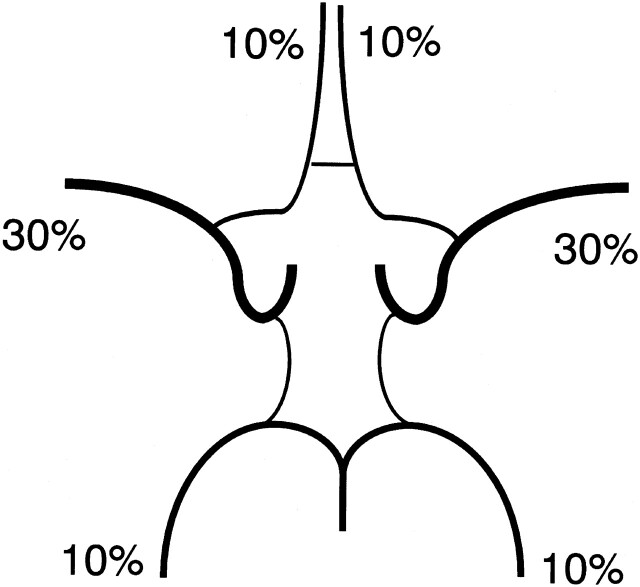
Methods: We prospectively examined 125 healthy volunteers by MR imaging. Variations in the circle of Willis were classified as "textbook" type, hypoplasia of the precommunicating segment of the anterior cerebral artery (A1), hypoplasia of the precommunicating segment of the posterior cerebral artery (P1), or "other." Volume flow rates were measured by 2D cine phase-contrast MR imaging. Lumen boundaries and volume flow rates were semiautomatically determined by pulsatility-based segmentation.

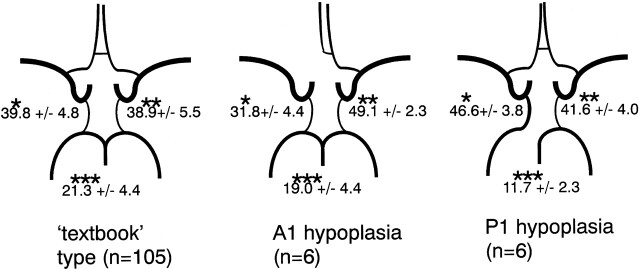
Results: Of the 117 subjects (61 men, 56 women; mean age, 23.6 years) considered suitable for flow measurement, 105 showed textbook type, and 6 each showed A1 hypoplasia and P1 hypoplasia. Total flow rates for the 3 variations were 781 +/- 151 mL/min (mean +/- SD), 744 +/- 119, and 763 +/- 129, respectively. Relative contributions by flow rates of the internal carotid arteries and the basilar artery for the 3 variations were 39.8%:38.9%:21.3%, 31.8%:49.1%:19.0%, and 46.6%:41.6%:11.7%, respectively, showing statistically significant differences.

Conclusions: Variations in the circle of Willis correlate significantly with relative contributions by the flow rates of the bilateral internal carotid and basilar arteries.


Figures

Fig 1.
Fig 1.
MR examination and flow measurement procedures for a representative case (23-year-old woman). A, Lateral view of 3D time-of-flight MR angiography. The white line indicates the section used for the phase-contrast MR imaging. B, Axial view of 3D time-of-flight MR angiography. The variation in the circle of Willis in this case was assessed as hypoplasia of the precommunicating segment of the right anterior cerebral artery (right A1 hypoplasia) based on diameter measurements obtained from the original MR angiography images. C, As the first step of flow measurement, an operator selected 3 pixels from each artery. These pixels are shown as red dots in this phase-contrast image. The inset in the bottom right corner shows a magnified image of the basilar artery for instance. D, From these selected pixels, vessel lumens (clusters of red dots) were automatically identified by pulsatility-based segmentation. To compensate for eddy current-induced error, 3 static regions of interest (clusters of blue dots) were also determined automatically. This compensation was based on the assumption that the error induced by the eddy current was a linear function of space. Eventually volume flow rate of each arterywas automatically obtained.
Fig 2.
Fig 2.
Classification of the anatomic variations in the circle of Willis. In the “textbook” type, both the precommunicating segment of the anterior cerebral artery (A1) and that of the posterior cerebral artery (P1) were normal in size. The next group included both right and left A1 hypoplasia. Because no significant difference between cerebral arteries on the right and left sides has been established,, we combined right and left A1 hypoplasia into A1 hypoplasia. The next group included right and left P1 hypoplasia, which again were treated as a single category, P1 hypoplasia. “Other” type included a combination of A1 hypoplasia and P1 hypoplasia, bilateral P1 hypoplasia, as well as other unclassified variations. ACA indicates anterior cerebral artery; ACo, anterior communicating artery; MCA, middle cerebral artery; ICA, internal cerebral artery; PCo, posterior communicating artery; PCA, posterior cerebral artery; BA, basilar artery
Fig 3.
Fig 3.
Relative contribution of proximal arteries to total volume flow in variations in the circle of Willis. Values signify mean percentage ± SD. The upper left value corresponds to the relative contribution of the right internal carotid artery in the “textbook” type or of the internal carotid artery ipsilateral to hypoplastic A1 or P1 in the other variations. The upper right value corresponds to the relative contribution of the left internal carotid artery in the “textbook” type, or of the internal carotid artery contralateral to hypoplastic A1 or P1 in the other variations. The value at the bottom corresponds to the relative contribution of the basilar artery. * The value for A1 hypoplasia variation was significantly smaller than those for “textbook” type and P1 hypoplasia variation. The value for P1 hypoplasia variation was significantly larger than that for “textbook” type. ** The value for A1 hypoplasia variation was significantly larger than that for “textbook” type. *** The value for P1 hypoplasia variation was significantly smaller than that for “textbook” type.
Fig 4.
Fig 4.
Estimated volume flow ratio of the anterior, middle, and posterior cerebral artery. These values were estimated from Fig 3 and approximated to multiples of 10%.

References

    1. Rutgers DR, Klijn CJM, Kappelle LJ, et al. Recurrent stroke in patients with symptomatic carotid artery occlusion is associated with high-volume flow to the brain and increased collateral circulation. Stroke 2004;35:1345–49 - PubMed
    1. Van den Boom R, Lesnik Oberstein SA, Spilt A, et al. Cerebral hemodynamics and white matter hyperintensities in CADASIL. J Cereb Blood Flow Metab 2003;23:599–604 - PubMed
    1. Kato T, Indo T, Yoshida E, et al. Contrast-enhanced 2D cine phase MR angiography for measurement of basilar artery blood flow in posterior circulation ischemia. AJNR Am J Neuroradiol 2002;23:1346–51 - PMC - PubMed
    1. Rutgers DR, Blankensteijn JD, Van der Grond J. Preoperative MRA flow quantification in CEA patients: flow differences between patients who develop cerebral ischemia and patients who do not develop cerebral ischemia during cross-clamping of the carotid artery. Stroke 2000;31:3021–28 - PubMed
    1. Buijs PC, Krabbe-Hartkamp MJ, Bakker CJG, et al. Effect of age on cerebral blood flow: measurement with ungated two-dimensional phase-contrast MR angiography in 250 adults. Radiology 1998;209:667–74 - PubMed

LinkOut - more resources