

Mitogen-activated protein kinases inhibit the ROMK (Kir 1.1)-like small conductance K channels in the cortical collecting duct
- PMID: 16971657
- PMCID: PMC2825048
- DOI: 10.1681/ASN.2006050426
Mitogen-activated protein kinases inhibit the ROMK (Kir 1.1)-like small conductance K channels in the cortical collecting duct
Abstract
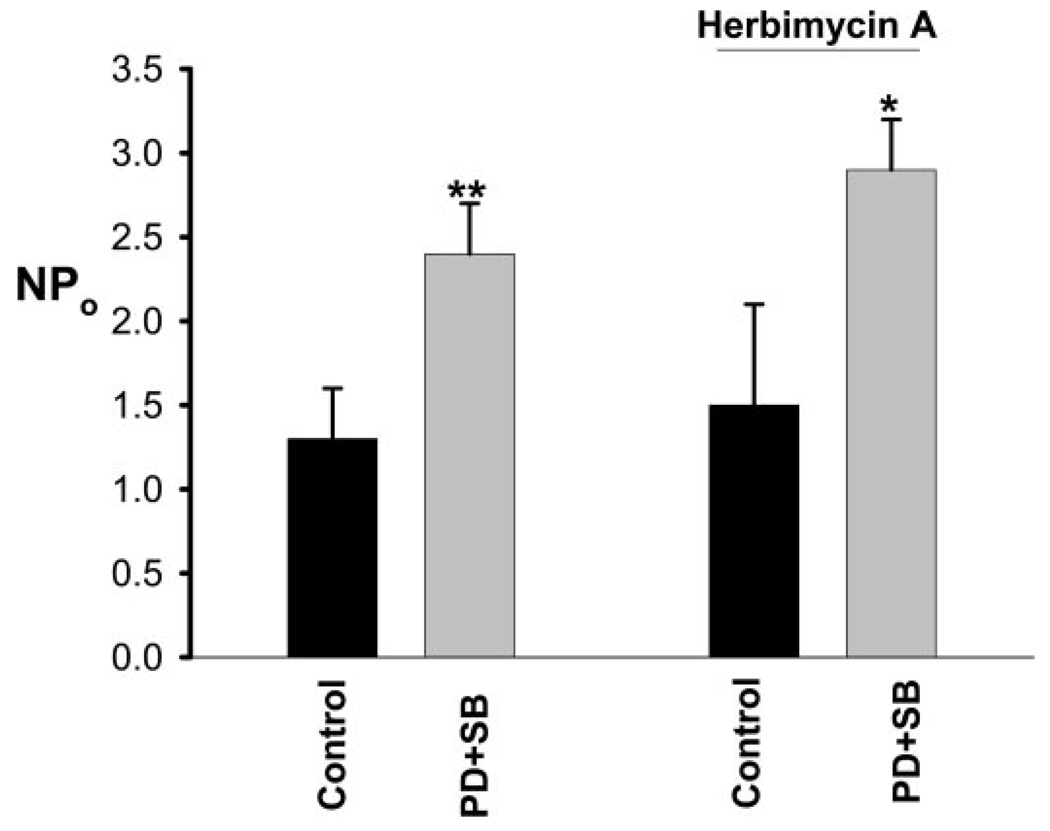
It was demonstrated previously that low dietary potassium (K) intake stimulates Src family protein tyrosine kinase (PTK) expression via a superoxide-dependent signaling. This study explored the role of mitogen-activated protein kinase (MAPK) in mediating the effect of superoxide anions on PTK expression and ROMK (Kir 1.1) channel activity. Western blot analysis demonstrated that low K intake significantly increased the phosphorylation of P38 MAPK (P38) and extracellular signal-regulated kinase (ERK) but had no effect on phosphorylation of c-JUN N-terminus kinase in renal cortex and outer medulla. The stimulatory effect of low K intake on P38 and ERK was abolished by treatment of rats with tempol. The possibility that increases in superoxide and related products that are induced by low K intake were responsible for stimulating phosphorylation of P38 and ERK also was supported by the finding that application of H(2)O(2) increased the phosphorylation of ERK and P38 in the cultured mouse collecting duct cells. Simultaneous blocking of ERK and P38 completely abolished the effect of H(2)O(2) on c-Src expression in mouse collecting duct cells. For determination of the role of P38 and ERK in the regulation of ROMK-like small-conductance K (SK) channels, the patch-clamp technique was used to study the effect of inhibiting P38 and ERK on SK channels in the cortical collecting duct from rats that were on a control K diet (1.1%) and on a K-deficient diet for 1 d. Inhibition of ERK, c-JUN N-terminus kinase, or P38 alone had no effect on SK channels. In contrast, simultaneous inhibition of P38 and ERK significantly increased channel activity. The effect of inhibiting MAPK on SK channels was not affected in the presence of herbimycin A, a PTK inhibitor, and was larger in rats that were on a K-deficient diet than in rats that were on a normal-K diet. However, the stimulatory effect of inhibiting ERK and P38 on SK was absent in the cortical collecting duct that was treated with colchicine. It is concluded that low K intake-induced increases in superoxide levels are responsible for stimulation of P38 and ERK and that MAPK inhibit the SK channels by stimulating PTK expression and via a PTK-independent mechanism.
Figures


Similar articles
-
Decrease in dietary K intake stimulates the generation of superoxide anions in the kidney and inhibits K secretory channels in the CCD.Am J Physiol Renal Physiol. 2010 Jun;298(6):F1515-22. doi: 10.1152/ajprenal.00502.2009. Epub 2010 Mar 31. Am J Physiol Renal Physiol. 2010. PMID: 20357031 Free PMC article.
-
Effect of hydrogen peroxide on ROMK channels in the cortical collecting duct.Am J Physiol Renal Physiol. 2007 Apr;292(4):F1151-6. doi: 10.1152/ajprenal.00389.2006. Epub 2006 Dec 12. Am J Physiol Renal Physiol. 2007. PMID: 17164397 Free PMC article.
-
Superoxide anions are involved in mediating the effect of low K intake on c-Src expression and renal K secretion in the cortical collecting duct.J Biol Chem. 2005 Mar 18;280(11):10790-6. doi: 10.1074/jbc.M414610200. Epub 2005 Jan 11. J Biol Chem. 2005. PMID: 15644319 Free PMC article.
-
Renal potassium channels: recent developments.Curr Opin Nephrol Hypertens. 2004 Sep;13(5):549-55. doi: 10.1097/00041552-200409000-00011. Curr Opin Nephrol Hypertens. 2004. PMID: 15300162 Review.
-
Regulation of ROMK (Kir1.1) channels: new mechanisms and aspects.Am J Physiol Renal Physiol. 2006 Jan;290(1):F14-9. doi: 10.1152/ajprenal.00093.2005. Am J Physiol Renal Physiol. 2006. PMID: 16339961 Free PMC article. Review.
Cited by
-
Regulatory control of the Na-Cl co-transporter NCC and its therapeutic potential for hypertension.Acta Pharm Sin B. 2021 May;11(5):1117-1128. doi: 10.1016/j.apsb.2020.09.009. Epub 2020 Sep 22. Acta Pharm Sin B. 2021. PMID: 34094823 Free PMC article. Review.
-
The Angiotensin II Type 1 Receptor-Associated Protein Attenuates Angiotensin II-Mediated Inhibition of the Renal Outer Medullary Potassium Channel in Collecting Duct Cells.Front Physiol. 2021 May 14;12:642409. doi: 10.3389/fphys.2021.642409. eCollection 2021. Front Physiol. 2021. PMID: 34054566 Free PMC article.
-
Mechanisms protecting host cells against bacterial pore-forming toxins.Cell Mol Life Sci. 2019 Apr;76(7):1319-1339. doi: 10.1007/s00018-018-2992-8. Epub 2018 Dec 27. Cell Mol Life Sci. 2019. PMID: 30591958 Free PMC article. Review.
-
Inhibition of K+ secretion in the distal nephron in nephrotic syndrome: possible role of albuminuria.J Physiol. 2011 Jul 15;589(Pt 14):3611-21. doi: 10.1113/jphysiol.2011.209692. Epub 2011 May 23. J Physiol. 2011. PMID: 21606114 Free PMC article.
-
K restriction inhibits protein phosphatase 2B (PP2B) and suppression of PP2B decreases ROMK channel activity in the CCD.Am J Physiol Cell Physiol. 2008 Mar;294(3):C765-73. doi: 10.1152/ajpcell.00528.2007. Epub 2008 Jan 9. Am J Physiol Cell Physiol. 2008. PMID: 18184875 Free PMC article.
References
-
- Giebisch G. Renal potassium transport: Mechanisms and regulation. Am J Physiol. 1998;274:F817–F833. - PubMed
-
- DuBose TD, Jr, Gitomer J, Codina J. H+,K+-ATPase. Curr Opin Nephrol Hypertens. 1999;8:597–602. - PubMed
-
- Wang WH. Regulation of renal K transport by dietary K intake. Annu Rev Physiol. 2004;66:547–569. - PubMed
-
- Chu PY, Quigley R, Babich V, Huang CL. Dietary potassium restriction stimulates endocytosis of ROMK channel in rat cortical collecting duct. Am J Physiol Renal Physiol. 2003;285:F1179–F1187. - PubMed
Publication types
MeSH terms
Substances
Grants and funding
LinkOut - more resources
Full Text Sources
Other Literature Sources
Medical
Miscellaneous
