. 2006;8(5):R149.
doi: 10.1186/ar2042.

Decreased metalloproteinase production as a response to mechanical pressure in human cartilage: a mechanism for homeostatic regulation

Affiliations

Decreased metalloproteinase production as a response to mechanical pressure in human cartilage: a mechanism for homeostatic regulation

Jordi Monfort et al. Arthritis Res Ther. 2006.

Abstract

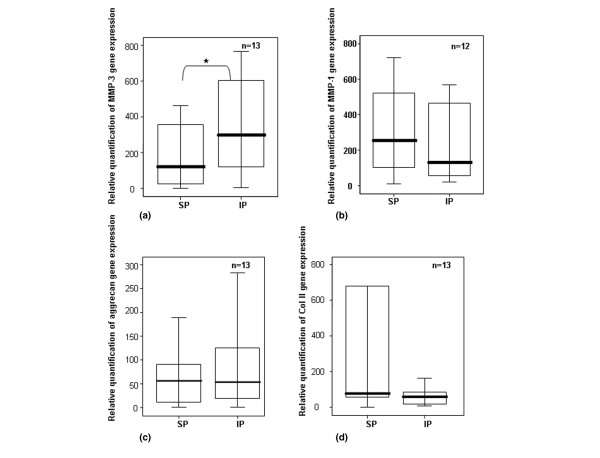
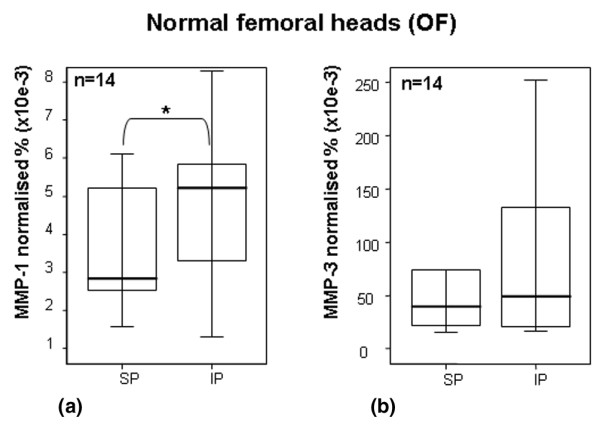
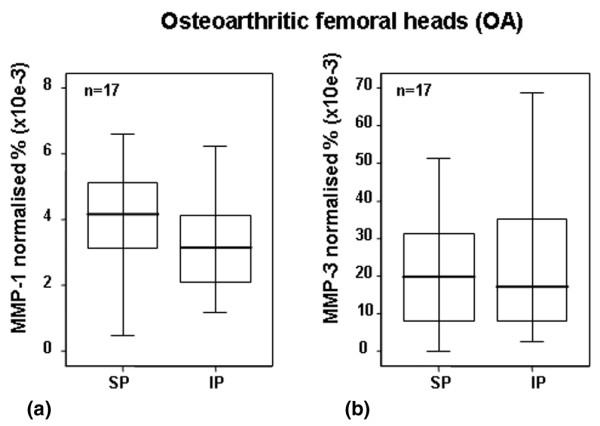
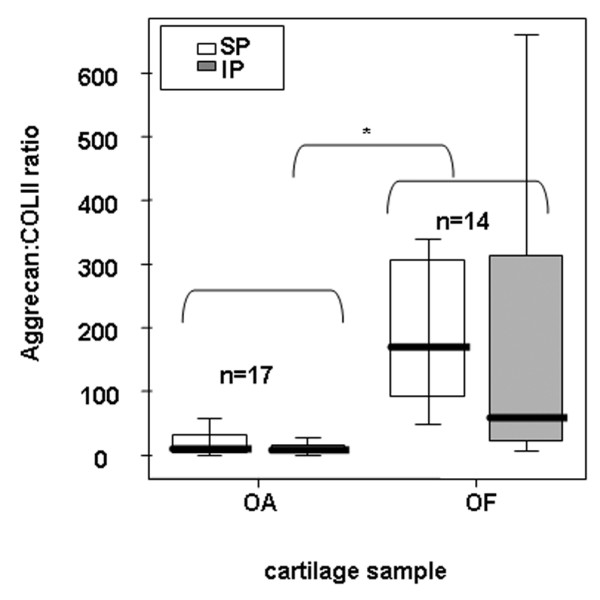
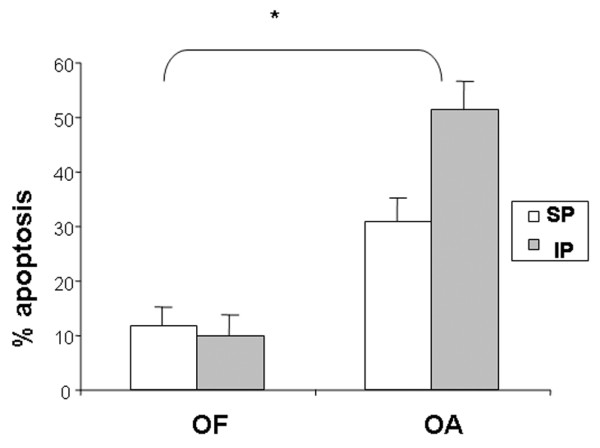
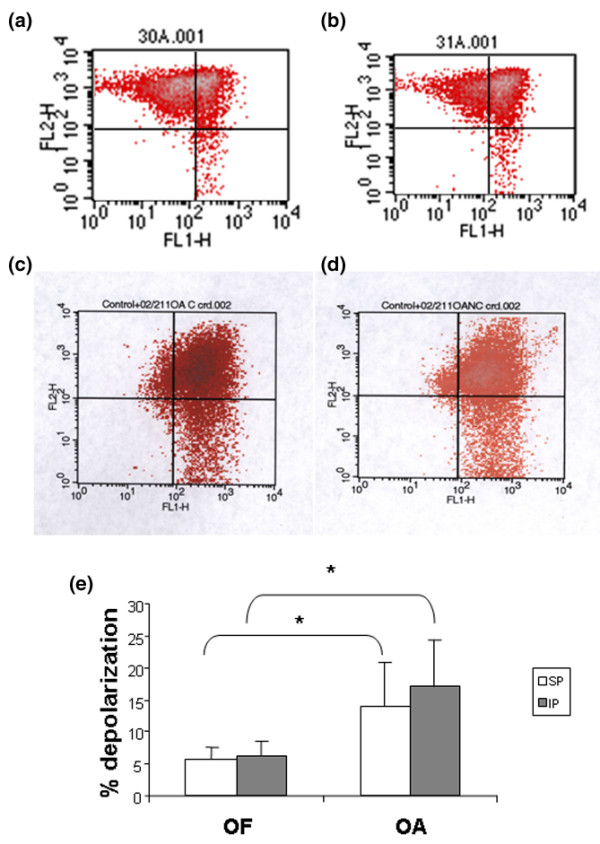
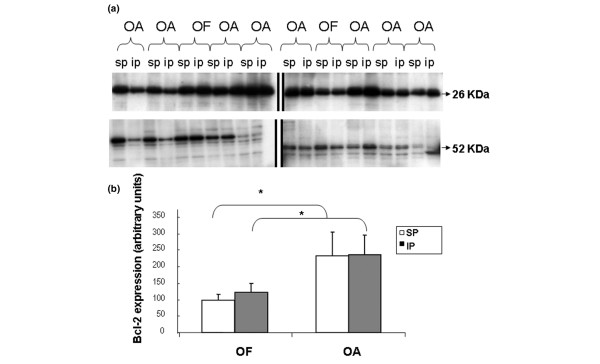
Articular cartilage is optimised for bearing mechanical loads. Chondrocytes are the only cells present in mature cartilage and are responsible for the synthesis and integrity of the extracellular matrix. Appropriate joint loads stimulate chondrocytes to maintain healthy cartilage with a concrete protein composition according to loading demands. In contrast, inappropriate loads alter the composition of cartilage, leading to osteoarthritis (OA). Matrix metalloproteinases (MMPs) are involved in degradation of cartilage matrix components and have been implicated in OA, but their role in loading response is unclear. With this study, we aimed to elucidate the role of MMP-1 and MMP-3 in cartilage composition in response to mechanical load and to analyse the differences in aggrecan and type II collagen content in articular cartilage from maximum- and minimum-weight-bearing regions of human healthy and OA hips. In parallel, we analyse the apoptosis of chondrocytes in maximal and minimal load areas. Because human femoral heads are subjected to different loads at defined sites, both areas were obtained from the same hip and subsequently evaluated for differences in aggrecan, type II collagen, MMP-1, and MMP-3 content (enzyme-linked immunosorbent assay) and gene expression (real-time polymerase chain reaction) and for chondrocyte apoptosis (flow cytometry, bcl-2 Western blot, and mitochondrial membrane potential analysis). The results showed that the load reduced the MMP-1 and MMP-3 synthesis (p < 0.05) in healthy but not in OA cartilage. No significant differences between pressure areas were found for aggrecan and type II collagen gene expression levels. However, a trend toward significance, in the aggrecan/collagen II ratio, was found for healthy hips (p = 0.057) upon comparison of pressure areas (loaded areas > non-loaded areas). Moreover, compared with normal cartilage, OA cartilage showed a 10- to 20-fold lower ratio of aggrecan to type II collagen, suggesting that the balance between the major structural proteins is crucial to the integrity and function of the tissue. Alternatively, no differences in apoptosis levels between loading areas were found--evidence that mechanical load regulates cartilage matrix composition but does not affect chondrocyte viability. The results suggest that MMPs play a key role in regulating the balance of structural proteins of the articular cartilage matrix according to local mechanical demands.


Figures

Figure 1
Figure 1
Gene expression of MMPs, aggrecan, and type II collagen. Quantification of gene expression of (a) MMP-3, (b) MMP-1, (c) aggrecan, and (d) type II collagen in chondrocytes from normal human femoral heads using real-time polymerase chain reaction. 18S rRNA was used as endogenous control, and the results are relative to a certain sample pertaining to the experiment. Separated maximum (SP) and minimum (IP) mechanical load areas were obtained from each femoral head. The horizontal bar shows the median, the box is the interquartile range, and the vertical lines show the atypical values. The Wilcoxon signed rank test was used to compare areas within the same joint. *Significant differences between poles, in MMP-3 values, were found, p < 0.05. No significant differences were found in MMP-1, aggrecan, and type II collagen gene expression. IP, inferior pole; MMP, matrix metalloproteinase; n, number of femoral heads used in the experiment; SP, superior pole.
Figure 2
Figure 2
Quantification of MMP-1 and MMP-3 by ELISA in OF cartilage. Quantification of (a) MMP-1 and (b) MMP-3 in articular cartilage from normal human femoral heads using ELISA. Values were normalised to total soluble protein, which was obtained after proteoglycan extraction and was quantified by Bradford method. Separated maximum (SP) and minimum (IP) mechanical load areas were obtained from each femoral head. The horizontal bar indicates the median, the box is the interquartile range, and the vertical lines indicate the atypical values. Median values were expressed as percentages. The Wilcoxon signed rank test was used to compare areas within the same joint. *Significant differences in MMP-1 values between areas were found (p < 0.05). No significant differences were found in MMP-3 values. ELISA, enzyme-linked immunosorbent assay; IP, inferior pole; MMP, matrix metalloproteinase; n, number of femoral heads used in the experiment; OF, osteoporotic fracture; SP, superior pole.
Figure 3
Figure 3
Quantification of MMP-1 (a) and MMP-3 (b) by ELISA in OA cartilage. Quantification of MMP-1 and MMP-3 in articular cartilage from OA human femoral heads using ELISA. Values were normalised to total soluble protein, and medians were expressed as percentages. Separated maximum (SP) and minimum (IP) mechanical load areas were obtained from each femoral head. The horizontal bar indicates the median, the box is the interquartile range, and the vertical lines indicate the atypical values. The Wilcoxon signed rank test was used to compare areas within the same joint. No significant differences between areas were found. ELISA, enzyme-linked immunosorbent assay; IP, inferior pole; MMP, matrix metalloproteinase; n, number of femoral heads used in the experiment; OA, osteoarthritis; SP, superior pole.
Figure 4
Figure 4
Analysis of aggrecan and type II collagen in OF and OA cartilage. Ratio of aggrecan to type II collagen in the cartilage matrix of OA and OF femoral heads and comparison between areas (SP and IP). Aggrecan and type II collagen were quantified using ELISA after cartilage proteoglycan extraction. Aggrecan was assessed from supernatant soluble fraction, and collagen was assessed from pellet fraction of the same tube. The horizontal bar indicates the median, the box is the interquartile range, and the vertical lines indicate the atypical values. *Significant differences between OA and OF heads were found (p < 0.05) using the Mann-Whitney U test. These differences were found for both poles. No significant differences between weight-bearing areas were found, but a trend was found between poles for OF hips (p = 0.057) using the Wilcoxon signed rank test. ELISA, enzyme-linked immunosorbent assay; IP, inferior pole; n, number of femoral heads used in the experiment for each cartilage condition (osteoarthritis or osteoporotic fracture); OA, osteoarthritis; OF, osteoporotic fracture; SP, superior pole.
Figure 5
Figure 5
Quantification of apoptosis in OF and OA cartilage. Quantification of apoptosis. Percentage of apoptotic cells measured by flow cytometry of OA (n = 6) or OF (n = 3) femoral heads and comparison between areas (SP and IP). No differences were found between areas for either set of cartilage conditions. *Significant differences (p < 0.05) were found between OA and OF cartilage. IP, inferior pole; OA, osteoarthritis; OF, osteoporotic fracture; SP, superior pole.
Figure 6
Figure 6
Mitochondrial depolarisation in OF and OA chondrocytes. Percentage depolarisation of OA or OF femoral heads and comparison between areas (SP and IP). (a, b) OF cartilage. (a) and (b) show results of chondrocytes from SP and IP zones, respectively. (c, d) OA cartilage. (c) and (d) show results of chondrocytes from SP and IP zones, respectively. (e) Quantification of mitochondrial depolarization. No differences were found between areas for either set of cartilage conditions. *Significant differences were found between OA and OF cartilage. IP, inferior pole; OA, osteoarthritis; OF, osteoporotic fracture; SP, superior pole.
Figure 7
Figure 7
Analysis of bcl-2 in OA and OF chondrocytes. Western blot of bcl-2 in OA or normal (OF) chondrocytes and comparison between areas (SP and IP). (a) Aliquots of total cell lysates were subjected to SDS-PAGE; immunoblotting was performed using anti-blc-2 antibody as described in Materials and methods. Molecular size markers are shown on the left (26 kDa = bcl2; 52 kDa = Tubulin). Data are representative of four separate experiments. (b) Percentage of basal protein expressed as arbitrary densitometric units. Levels of bcl-2 protein were significantly higher in OA cartilage than in normal cartilage. IP, inferior pole; OA, osteoarthritis; OF, osteoporotic fracture; SP, superior pole.

References

    1. Aigner T, Hemmel M, Neureiter D, Gebhard PM, Zeiler G, Kirchner T, McKenna L. Apoptotic cell death is not a widespread phenomenon in normal aging and osteoarthritic human articular knee cartilage. Arthritis Rheum. 2001;44:1304–1312. doi: 10.1002/1529-0131(200106)44:6<1304::AID-ART222>3.0.CO;2-T. - DOI - PubMed
    1. Bendele AM, White SL. Early histopathologic and ultrastructural alterations in femorotibial joints of partial medial meniscectomized guinea pigs. Vet Pathol. 1987;24:436–443. - PubMed
    1. Horton WE, Jr, Feng L, Adams C. Chondrocyte apoptosis in development, aging and disease. Matrix Biol. 1998;17:107–115. doi: 10.1016/S0945-053X(98)90024-5. - DOI - PubMed
    1. Welgus HG. Stromelysin: structure and function. Agents Actions Suppl. 1991;35:61–67. Review. - PubMed
    1. Nagase H, Ogata Y, Suzuki K, Enghild JJ, Salvesen G. Substrate specificities and activation mechanisms of matrix metalloproteinases. Biochem Soc Trans. 1991;19:715–718. Review. - PubMed

Publication types

MeSH terms

Substances