. 2006 Sep 15;23(6):925-31.
doi: 10.1016/j.molcel.2006.07.025.

Dynamic regulation of cAMP synthesis through anchored PKA-adenylyl cyclase V/VI complexes

Affiliations

Dynamic regulation of cAMP synthesis through anchored PKA-adenylyl cyclase V/VI complexes

Andrea L Bauman et al. Mol Cell. .

Abstract

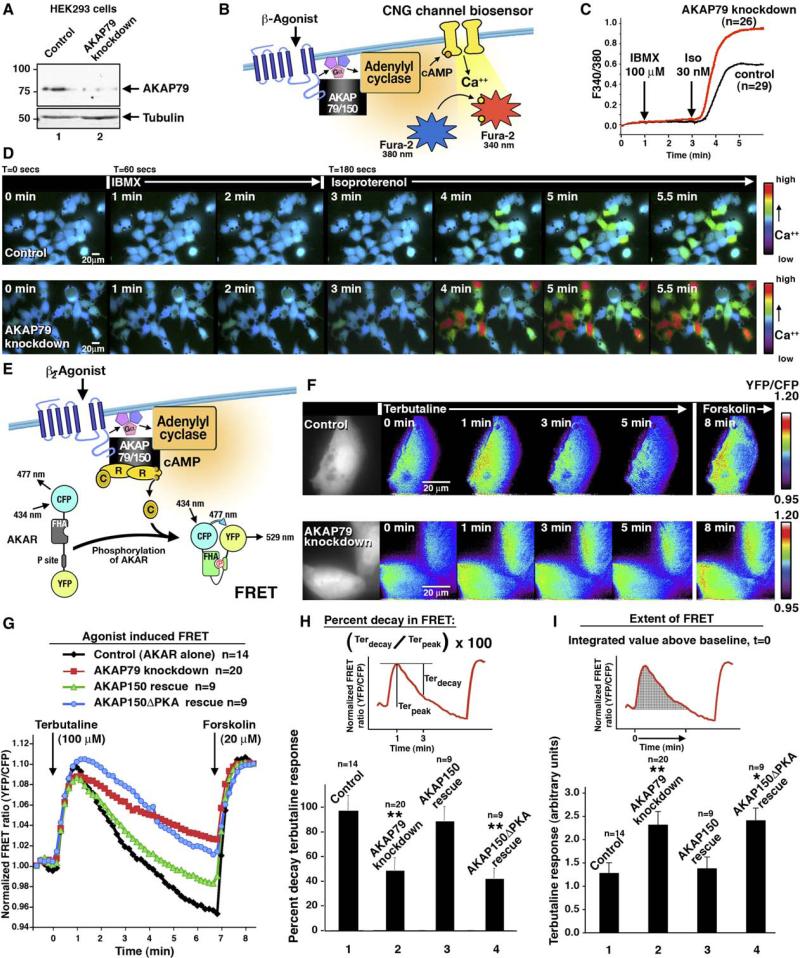
Spatiotemporal organization of cAMP signaling begins with the tight control of second messenger synthesis. In response to agonist stimulation of G protein-coupled receptors, membrane-associated adenylyl cyclases (ACs) generate cAMP that diffuses throughout the cell. The availability of cAMP activates various intracellular effectors, including protein kinase A (PKA). Specificity in PKA action is achieved by the localization of the enzyme near its substrates through association with A-kinase anchoring proteins (AKAPs). Here, we provide evidence for interactions between AKAP79/150 and ACV and ACVI. PKA anchoring facilitates the preferential phosphorylation of AC to inhibit cAMP synthesis. Real-time cellular imaging experiments show that PKA anchoring with the cAMP synthesis machinery ensures rapid termination of cAMP signaling upon activation of the kinase. This protein configuration permits the formation of a negative feedback loop that temporally regulates cAMP production.


Figures

Figure 1
Figure 1. AKAP150 Associates with ACV and ACVI
(A–D) Endogenous AC complexes were isolated from rat brain extract (RBE) by using forskolin-agarose affinity chromatography. Copurifying proteins were identified by RII overlay (A) or Western blots detecting (B) AKAP150, (C) RII, and (D) ACV and ACVI. (E) Immunoprecipitation of ACs from RBE was performed with antibodies against the ACI, ACII, or ACV/VI isoforms. Immunoblot analysis of each immune complex using anti-AKAP150 (top) and anti-RII (bottom) detected AC-associated proteins. (F) Measurement of the PKA activity in ACV/VI immune complexes from RBE. Activity measurements were performed with and without the PKA inhibitor PKI. Data are presented as the mean ± SEM from three independent experiments (p < 0.001). (G) Expression of FLAG-tagged AKAP79 alone or in combination with His-tagged ACV in HEK293 cells was followed by anti-FLAG immuno-precipitation of AKAP79. Coprecipitating AC activity was measured upon stimulation with forskolin and GαS-GTPγS. Data are presented as the mean ± SEM, from three independent experiments, each performed in duplicate (p < 0.001). (H) Reciprocal immunoprecipitations using the His tag to isolate ACV complexes were immunoblotted with anti-FLAG to detect coprecipitating AKAP79 (top). The expression levels of FLAG-AKAP79 in cell lysates were determined by immunoblot (bottom).
Figure 2
Figure 2. AKAP79-Associated PKA Modulates ACV Activity
(A) HEK293 cells expressing GαSQ227L were transfected with AKAP79 (column 2) or ACV (column 3), AKAP79 and ACV (column 4), or AKAP150 and ACV (column 5). Intracellular cAMP levels were measured by enzyme immunoassay. The data presented are from a single experiment that is representative of three separate experiments, each performed in duplicate. Data are presented as the mean ± SEM; p < 0.001. (B) Endogenous ACV/VI complexes were immunoprecipitated from rat brain extract, and the coprecipitating PKA was activated. Phosphorylation of the precipitated proteins was performed either in the presence of the PKA-anchoring inhibitor, AKAP-IS peptide, or the control scrambled AKAP-IS peptide. Phosphorylation was monitored by autoradiography of blots to detect incorporation of 32P into AC (top). ACV/VI expression levels were monitored by immunoblot (bottom). (C) Phosphate incorporation was quantified, and the results were averaged from three independent experiments. Data are presented as the mean ± SEM; p < 0.001. (D) ACV complexes were immunoprecipitated from HEK293 cells coexpressing AKAP79 or the PKA-anchoring defective mutant AKAP79-PP. Coprecipitating PKA was activated with cAMP, and phosphorylation was monitored by autoradiography of blots to detect incorporation of 32P into ACV (top). ACV expression levels were monitored by immunoblot (bottom). (E) Phosphate incorporation was quantified, and the results were averaged from three independent experiments. Data are presented as the mean ± SEM; p < 0.001. (F) HEK293 cells expressing GαSQ227L, ACV (column 3), ACV and AKAP79 (column 4), ACV and an AKAP79 unable to bind PKA (column 5), or AKAP18 (column 5) were lysed, and cAMP levels in the total cell lysate were measured. Data presented are the average of three separate experiments, each performed in duplicate. Data are presented as the mean ± SEM, p < 0.001.
Figure 3
Figure 3. Characterization of the ACV Ser-674 Ala Mutant
(A) (Top) Autoradiograph showing the 32P phosphate incorporation into wild-type ACV (lane 1) and the ACV S676A mutant (lane 2). (Bottom) ACV expression levels were monitored by immunoblot. (B) Results were quantified by densitometry, and data are presented as the mean ± SEM. (C) Graph of the levels of intracellular cAMP (pmol) in HEK293 cell lysates expressing the GαSQ227L constitutively active mutant. Data from cells expressing wild-type ACV (black) and the ACV S67A mutant (gray) are indicated. Data are representative of three separate experiments and are presented as mean ± SEM.
Figure 4
Figure 4. AKAP79 Synchronizes the Modulation of ACV Activity in Living Cells
(A) Silencing of AKAP79 expression in HEK293 cells was confirmed by immunoblot (top). Immunoblot for tubulin is the loading control (bottom). (B) Schematic diagram of a biosensor for cAMP production by AC in living cells. Activation of β-AR leads to activation of AC and cAMP production. In the presence of a PDE inhibitor, cAMP accumulates near the plasma membrane. A mutant CNG channel biosensor responds to cAMP, permitting calcium entry into Fura-2-loaded cells. The resulting shift in Fura-2 excitation (F340/380) is used to assess cAMP production. (C) Comparison of cAMP production in AKAP79-silenced cells (red, n = 26) or control cells (black, n = 29) transfected with the biosensor. (D) Representative pseudocolor images of a field of cells over a time course of 1 min intervals of the data presented in (C). (E) Schematic diagram of agonist induction of FRET in the PKA activity sensor AKAR2. Signaling from the β-AR leads to activation of AC and an increase in cAMP. Anchored PKA responds to the increased cAMP and phosphorylates AKAR2. (F) Representative pseudocolored images of FRET changes in control and AKAP79 knockdown HeLa cells (Figure S2) stimulated with terbuta-line (t = 0 min) followed with forskolin stimulation (t = 7 min). (G) Amalgamated FRET traces for control (black, n = 14), AKAP79 knockdown (red, n = 20), AKAP150 rescue of AKAP79 knockdown (green, n = 9), and rescue with a mutant AKAP150 that does not bind PKA (blue, n = 9). Analysis of the terbutaline response data presented in (F). (H) Graph depicting the percentage of FRET signal decay (Terdecay / Terpeak × 100) for each cell group. The terbutaline peak response (Terpeak) is the change in FRET from baseline to peak 1 min after application of agonist. The terbutaline decay (Terdecay) is the change in FRET from the peak response to the FRET value at 3 min. The percent decay represents the dynamics of the response for each cell group. The statistical significance of both AKAP79 knockdown versus control and AKAP150DPKA rescue versus control was calculated by using the ANOVA-Dunnett Multiple Comparisons Test and the p value for each was <0.01. Error bars indicate SEM. (I) The extent of elevated FRET analyzed as the integration of values above baseline from the time of application of terbutaline (t = 0) to the last time point above baseline preceding the addition of forskolin. The statistical significance of AKAP79 knockdown versus control was calculated by using the ANOVA-Dunnett Multiple Comparisons Test and the p value was <0.01. The statistical significance of AKAP150ΔPKA rescue versus control was calculated by using the ANOVA-Dunnett Multiple Comparisons Test and the p value was <0.05. Error bars indicate SEM.

Similar articles

Cited by

References

    1. Alto NM, Soderling SH, Hoshi N, Langeberg LK, Fayos R, Jennings PA, Scott JD. Bioinformatic design of A-kinase anchoring protein-in silico: a potent and selective peptide antagonist of type II protein kinase A anchoring. Proc. Natl. Acad. Sci. USA. 2003;100:4445–4450. - PMC - PubMed
    1. Asirvatham AL, Galligan SG, Schillace RV, Davey MP, Vasta V, Beavo JA, Carr DW. A-kinase anchoring proteins interact with phosphodiesterases in T lymphocyte cell lines. J. Immunol. 2004;173:4806–4814. - PubMed
    1. Baillie GS, Scott JD, Houslay MD. Compartmentalisation of phosphodiesterases and protein kinase A: opposites attract. FEBS Lett. 2005;579:3264–3270. - PubMed
    1. Bohn LM, Lefkowitz RJ, Gainetdinov RR, Peppel K, Caron MG, Lin FT. Enhanced morphine analgesia in mice lacking beta-arrestin 2. Science. 1999;286:2495–2498. - PubMed
    1. Bos JL. Epac: a new cAMP target and new avenues in cAMP research. Nat. Rev. Mol. Cell Biol. 2003;4:733–738. - PubMed

Publication types

MeSH terms

LinkOut - more resources