

Comment
doi: 10.1113/jphysiol.2006.118976.
Epub 2006 Sep 14.
What simple and complex cells compute
Affiliations
- PMID: 16973710
- PMCID: PMC1890437
- DOI: 10.1113/jphysiol.2006.118976
Item in Clipboard
Comment
What simple and complex cells compute
J Physiol.
.
No abstract available
Figures
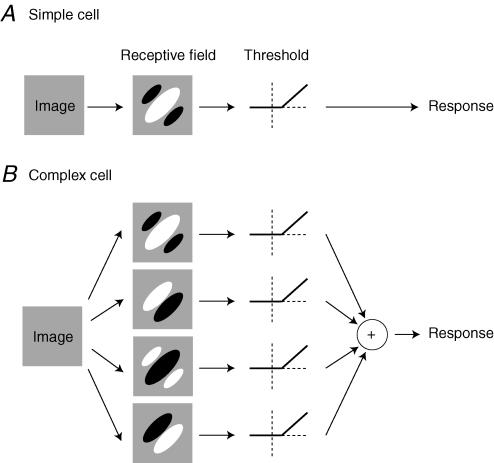
A, linear model of simple cells. The first stage is linear filtering, i. e. aweighted sum of the image intensities, with weights given by the receptive field. The second stage isrectification: only the part of the responses that is larger than a threshold is seen in the firing rate response. B, subunit model of complex cells. The first stage is linear filtering by a number of receptive fields such asthose of simple cells (here we show four of them with spatial phases offset by 90 deg). The subsequent stages involve rectification, and then summation.
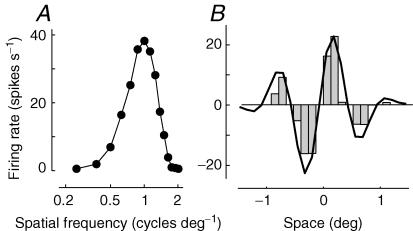
Responses were simulated from a model simple cell with a linear spatial receptive field that summates strongly distorted thalamic inputs (Carandini et al. 2002). A, spatial frequency tuning of the simple cell. The ordinate marks the amplitude of the sinusoidal modulation caused by drifting sinusoidal gratings, whose spatial frequency is plotted on the abscissa. B, profile of the receptive field of the simple cell. The histogram shows the firing rate elicited by flashing bars in various spatial positions across the receptive field. Negative responses indicate responses elicited when withdrawing the bar. The curve shows the prediction based on linearity, obtained by Fourier transform of the data in A.
Comment on
-
Spatial summation in the receptive fields of simple cells in the cat's striate cortex.J Physiol. 1978 Oct;283:53-77. doi: 10.1113/jphysiol.1978.sp012488. J Physiol. 1978. PMID: 722589 Free PMC article.
-
Receptive field organization of complex cells in the cat's striate cortex.J Physiol. 1978 Oct;283:79-99. doi: 10.1113/jphysiol.1978.sp012489. J Physiol. 1978. PMID: 722592 Free PMC article.
References
-
- Carandini M, Heeger DJ, Movshon JA. Linearity and gain control in V1 simple cells. In: Ulinski PS, Jones EG, Peters A, editors. Cerebral Cortex, Models of Cortical Circuits. Vol. 13. New York: Kluwer Academic/Plenum; 1999. pp. 401–443.
-
- Ferster D, Miller KD. Neural mechanisms of orientation selectivity in the visual cortex. Annu Rev Neurosci. 2000;23:441–471. - PubMed
Publication types
MeSH terms
LinkOut - more resources
Full Text Sources